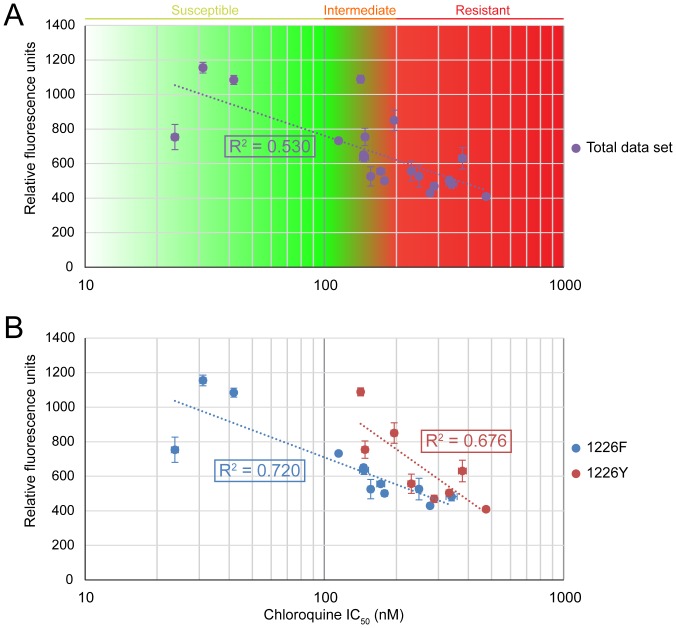
Figure 7. CQGREEN uptake correlates with CQ resistance.
(A) CQGREEN fluorescence is inversely correlated with CQ logIC50. Total data set shows moderate R 2 of 0.53. (B) When split into subpopulations on the basis of Pgh1 residue 1226, R 2 is improved. Data shown are means of at least 3 experiments. Error bars represent S.E.M.

