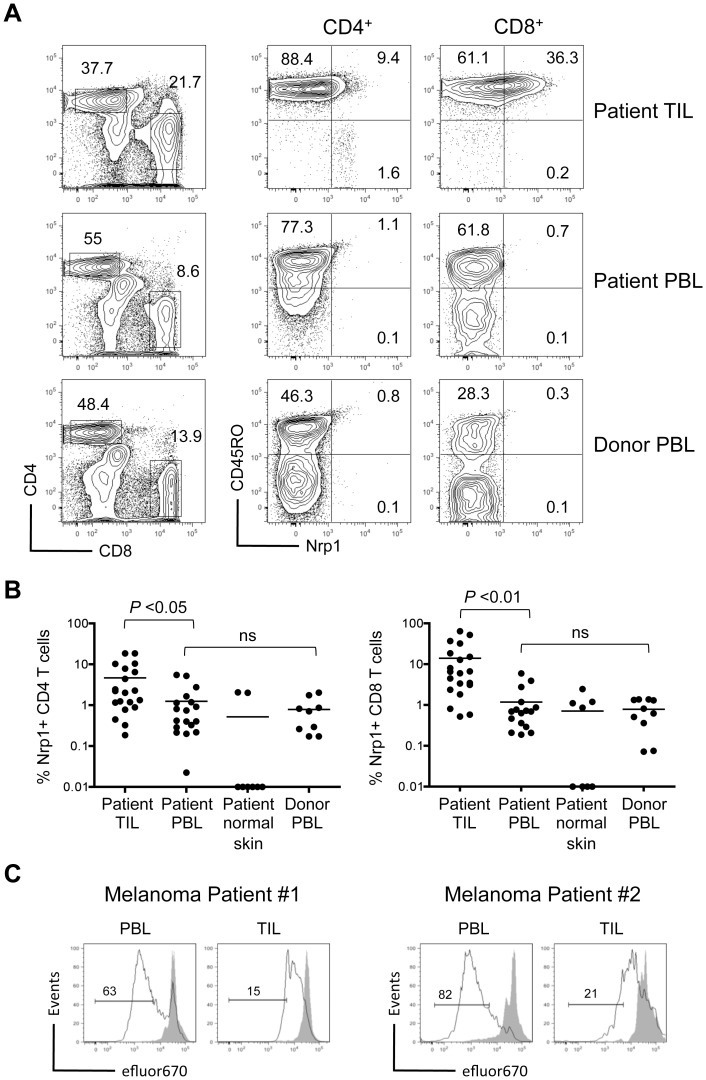
Figure 7. Nrp1 expression is increased on human tumor infiltrating T cells and corresponds with antigen experience.
CD45+ lymphocytes were analyzed from the blood (PBL) and tumor (TIL) of patients undergoing surgical resection of metastatic melanoma, and compared to lymphocytes from the blood of healthy donors. (A) The frequency of CD4+ and CD8+ T cells from the indicated tissues was compared (left) and co-expression of CD45R0 and Nrp1 assessed on these gated T cell populations (right). (B) The frequency of Nrp1+ T cells among TIL, patient PBL, normal skin tissue adjacent to tumor, or healthy donor PBL is displayed graphically. Results are pooled from 8–20 independent samples, with each circle representing data from one patient/donor. Horizontal bars represent the average for each group and P values are indicated (ns = not significant). (C) Proliferation of CD8+ T cells from patient PBL or TIL was directly compared following 3 day in vitro stimulation with anti-CD3/CD28 beads. Histograms show relative dilution of efluor670 dye in stimulated (black line) versus non-stimulated (grey filled peaks) for 2 representative patients. Inset numbers are the percent of cells within the indicated region.

