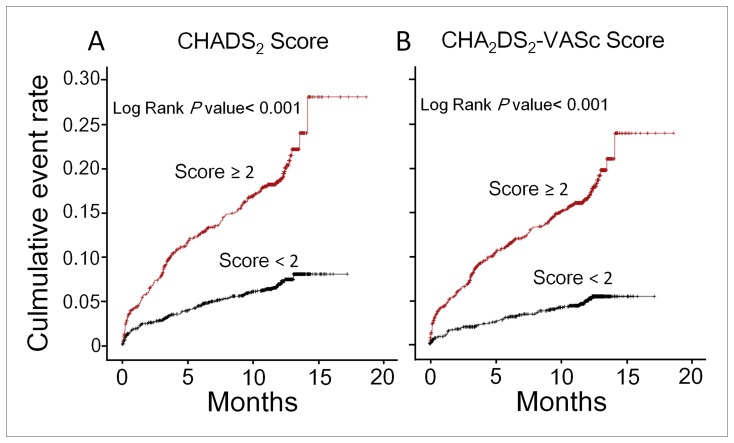
Figure 3. Kaplan-Meier curves for the time to the composite endpoint of myocardial infarction (MI), stroke, or death, according to CHADS2 and CHA2DS2-VASc scores.
Survival analysis showed that a CHADS2 score of ≥2 was associated with a higher event rate than a score of <2 (p<0.001; log-rank test) (A). In addition, a CHA2DS2-VASc score of ≥2 was a significant predictor of adverse events (p<0.001; log-rank test) (B).

