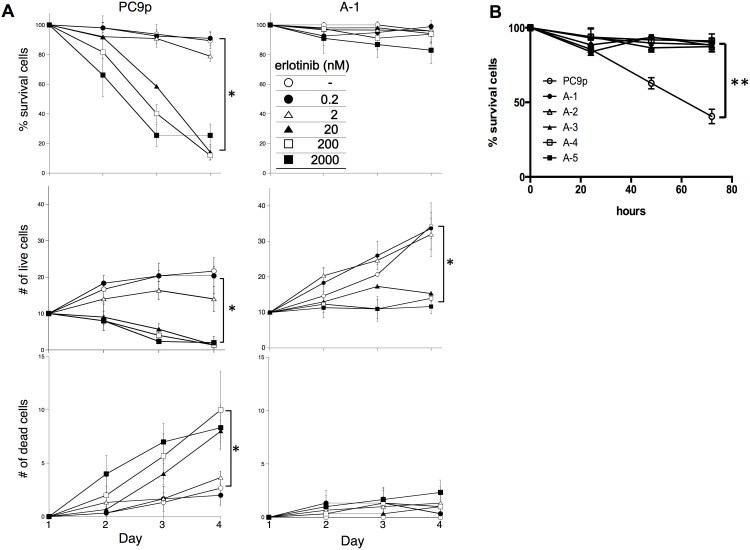
Figure 3.
A. A total of 5×10⁴ tumor cells were seeded in 24-well plates on day 0. Twenty-four hours after seeding, erlotinib or vehicle was added at the indicated concentrations. Numbers of live and dead cells were counted with trypan blue staining. % Survival indicates a percentage of live cells, which excluded trypan blue staining, based on total cell number in a well. Samples were prepared in triplicate. Data are presented as the mean ± SD. * is used to indicate significance. B. The %Survival of cancer cells treated with 20 nM erlotinib was demonstrated. A-1, 2, 3, 4, and 5 indicate clone numbers that were transfected with cDNA encoding DDX3X. The %Survival indicates the percentage of live cells that excluded the trypan blue stain, based on total cell number in a well. Samples were prepared in triplicate. Data are presented as the mean ± SD. **p<0.001.

