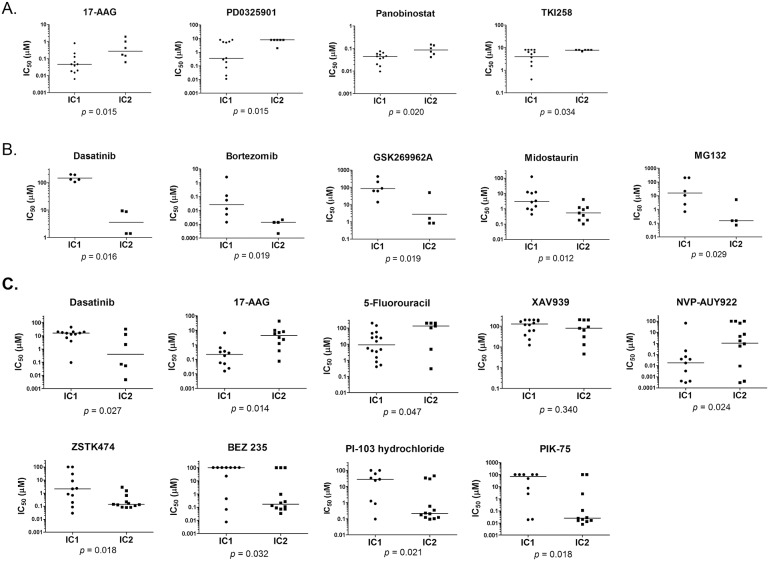
Figure 3. Dot plots of IC50 values for targeted inhibitors that have significant differences in toxicity to the Asian gastric cancer cells between the two integrated clusters.
(A) Targeted inhibitors from the CCLE database. (B) Targeted inhibitors from the Sanger COSMIC database. (C) Selected targeted inhibitors in our lab showing significant differences in sensitivity (except XAV939) towards the two clusters of cell lines. Y-axis is the IC50 values in log10 scale. P-value is computed by Mann Whitney U-test. Horizontal bars are medians for sample distributions.

