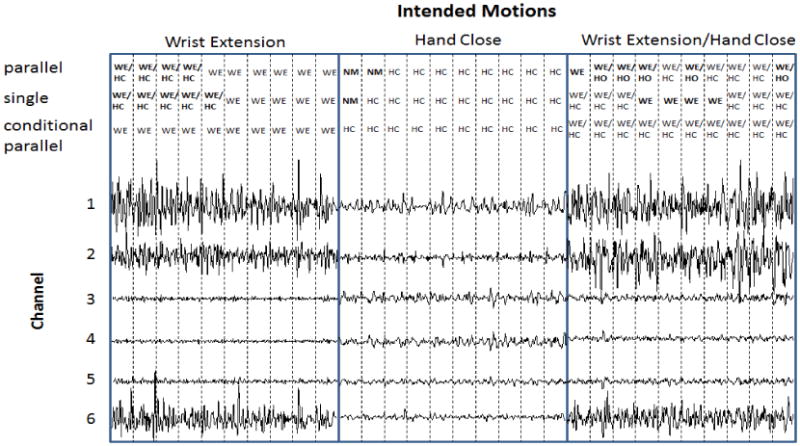
Fig. 7.

EMG signals for two discrete movements and their combined movement. EMG data is shown from one non-amputee subject and all six channels. Each vertical dotted line divides 50 ms of data, which corresponds to a single classifier decision. A total of 0.5 seconds of data is shown for each motion. The decisions of the parallel, single and conditional parallel strategies are shown for each window. Decisions in bold font were incorrectly classified, while decisions in black (non-bold) were correctly classified.
