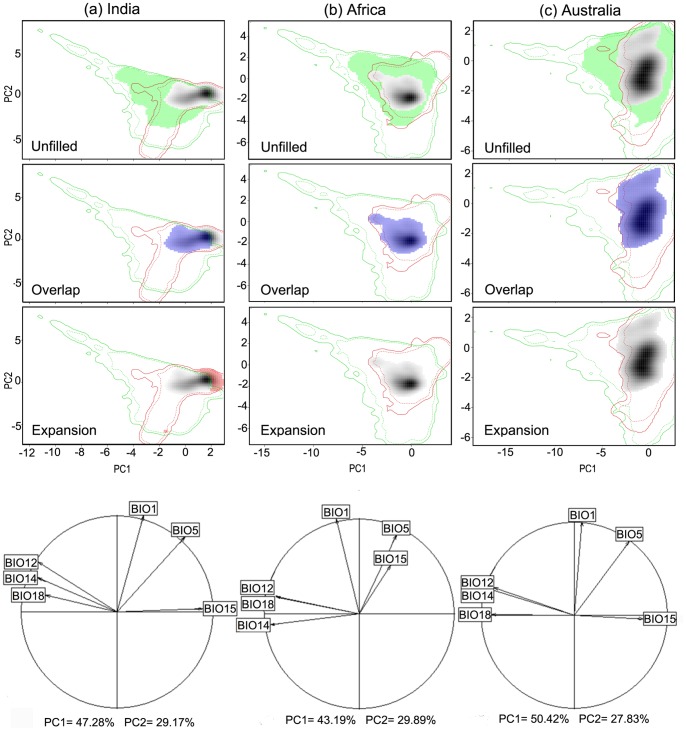
Figure 2. Niche dynamics of Lantana camara: from native to invaded ranges.
The contour lines delineate the available niche in its native range (green) and in its invaded range (red) in India (column a), Australia (column b) and Africa (column c). The solid and dashed contour lines illustrate, respectively, 100% and 50% of the available (background) environment. The colored areas correspond to the unfilled zone (green; line 1), the overlap zone (blue; line 2), or the expansion zone (red; line 3) resulting from overlaying the native niche with the invaded niche. The last line shows the correlation circles, which indicate the weight of each bioclimatic variable on the niche space defined by the first two principal component axes. The predictor climatic variables are BIO1 (annual mean temperature), BIO5 (temperature of warmest month), BIO12 (annual precipitation), BIO14 (precipitation of driest month), BIO15 (precipitation seasonality), BIO18 (precipitation of warmest quarter).

