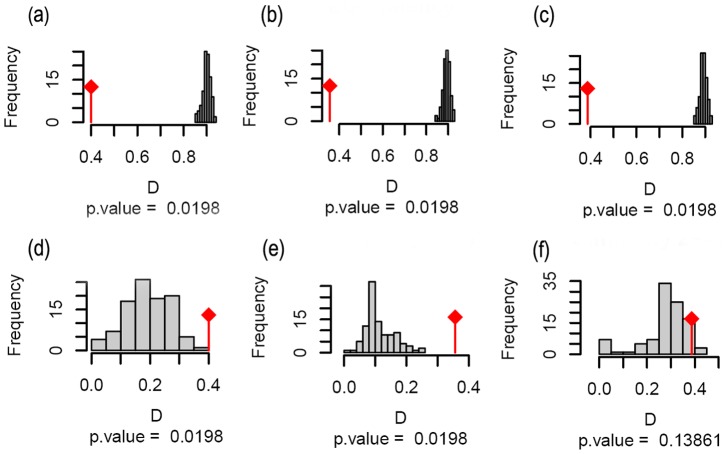
Figure 3. Statistical tests for niche comparisons between native and invaded regions.
Observed frequencies for the niche overlap index (D) in relation to the expected D for p = 0.05. The first line shows the tests for niche equivalency (a, b and c) and the second line for niche similarity (d, e, and f). The first column compares niches between the native range and Australia (a and d), the second column between the native range and Africa (b and e) and the third column between the native range and India (c and f).

