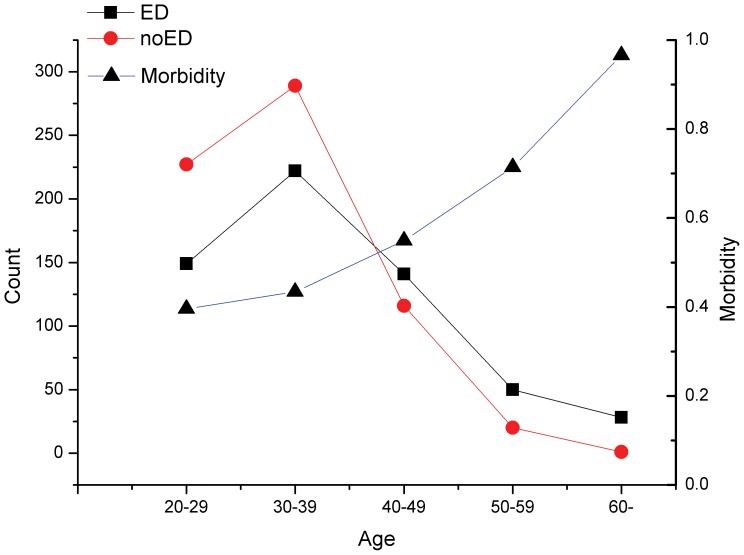
Figure 1. The tendency of the morbidity of erectile dysfunction (ED) along with age growth.
* X-axis stands for ages with 10 years range difference. * There are two Y-axes. On the left, the axis stands for the counts of ED or no-ED patients. As for the right one, it represents the morbidity of ED in different age brackets.

