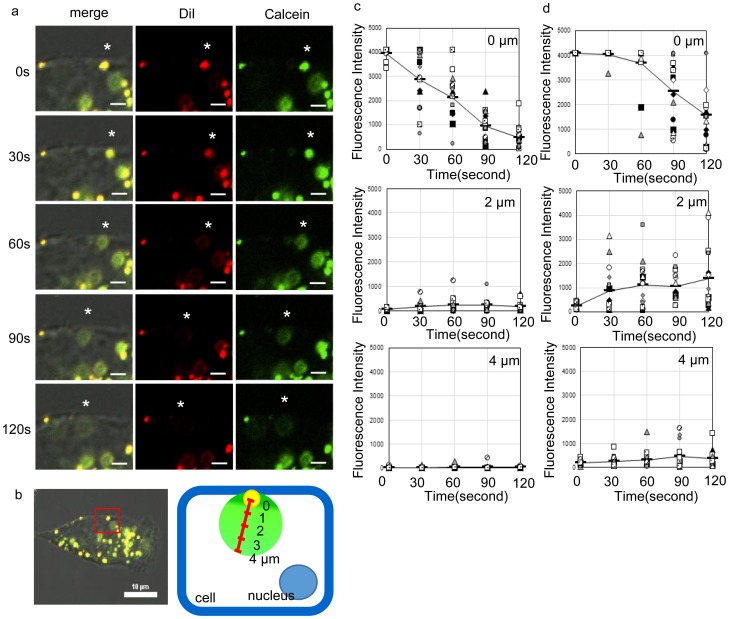
Figure 7. Time lapse imaging of LMDP-lipo by CLSM.
(a) DiI-labeled and calcein-encapsulated LMDP-lipo (EPC/DOPE/CHEMS/5 mol% LMDP) was added to A549 cells and incubated at 37°C. CM-DiI (red) and calcein (green) were observed at intervals of 30 sec by CLSM. Asterisks indicate the same LMDP-lipo. Scale bars, 2 µm. (b) Schematic image of fluorescence measurement. Fluorescence intensities of CM-DiI and calcein were measured at 0, 2 and 4 µm from the centers of dots indicating fluorescent-labeled liposomes taken up by the cells. Changes in fluorescence intensity in 3 dots/cell for 5 cells at the indicated times were analyzed for CM-DiI (c) and calcein (d) using NIS-Elements software.

