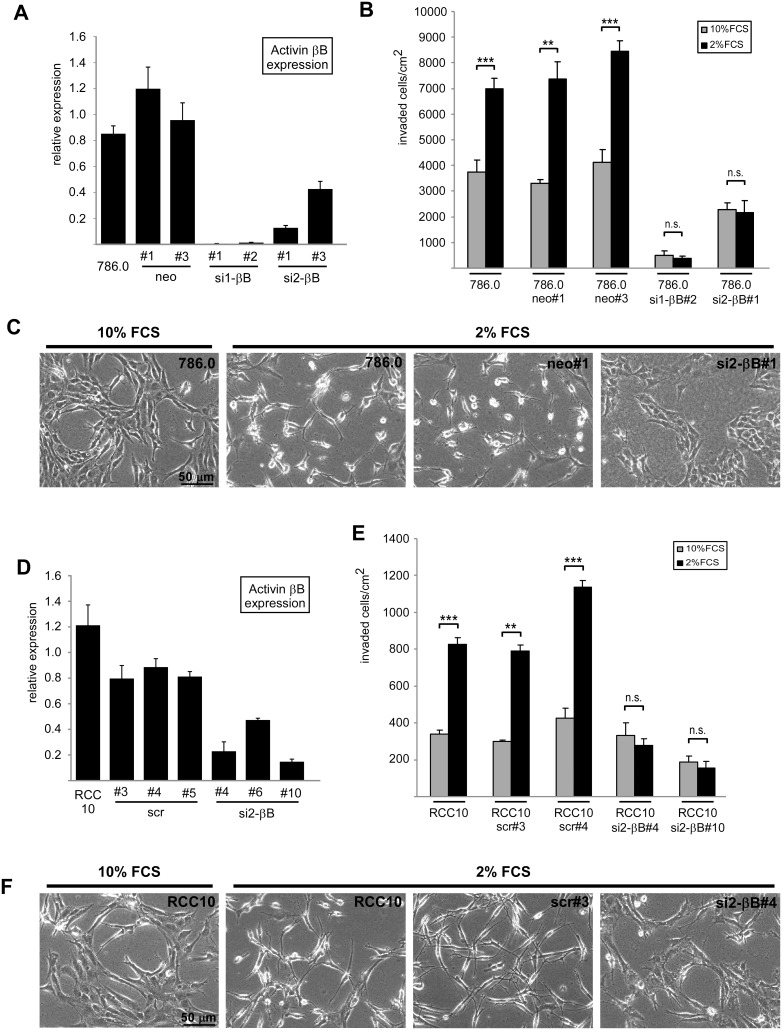
Figure 1. Activin B dependent invasion of ccRCC cells is inhibited by serum.
(A) Relative Activin B expression of 786.0 parental tumor cells and individual clones carrying empty vector (neo#1, #3) and two different shRNAs targeting Activin B mRNA (si1-βB#1 and #2, si2-βB#1 and #3), respectively, determined by quantitative realtime RT-PCR. Results were normalized on β-actin expression. (B) Invasion of parental 786.0 tumor cells, neo control clones and Activin B knockdown clones plated on collagen I gels in the presence of 2% (black bars) and 10% FCS (grey bars). Number of invaded cells was quantified after 3 days. (C) Phase contrast micrographs corresponding to B depicting the morphology of the indicated cell lines on the surface of the collagen I gel. (D) Relative Activin B expression of RCC10 parental tumor cells and individual clones carrying scrambled shRNA (scr#3, #4, #5) and shRNA targeting Activin B mRNA (si2-βB#4, #6, #10), respectively, determined by quantitative realtime RT-PCR. Results were normalized on β-actin expression. (E) Invasion of parental RCC10 tumor cells, scrambled control clones and Activin B knockdown clones plated on collagen I gels in the presence of 2% (black bars) and 10% FCS (grey bars). Number of invaded cells was quantified after 3 days. (F) Phase contrast micrographs corresponding to E depicting the morphology of the indicated cell lines on the surface of the collagen I gel. Bars in A, B, D and E represent the mean of three independent experiments, error bars indicate standard deviation. Statistical significance was determined by Student’s t-test and denoted by asterisks: **P<0.01; ***P<0.001; n.s. not significant.

