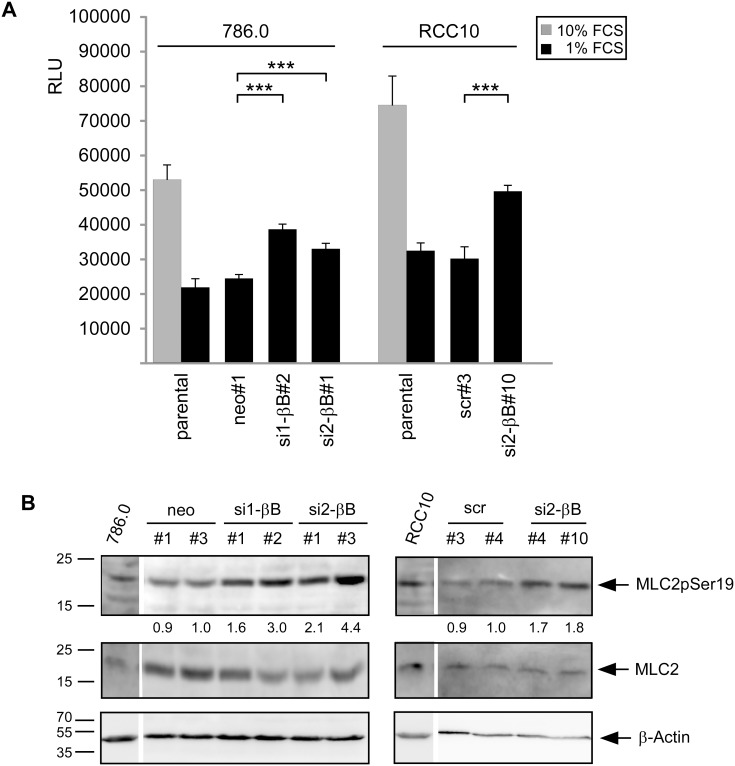
Figure 3. Knockdown of Activin B activates the RhoA pathway.
(A) Endogenous RhoA activity of the indicated cell lines determined by G-Lisa assay. Bars represent the mean of three independent experiments, error bars indicate standard deviation. Statistical significance was determined by ANOVA analysis and denoted by asterisks; ***P<0.001. (B) Western Blot analysis of Myosin Light Chain 2 (MLC2) phosphorylated at Serin 19 in the indicated cell lines upon serum starvation (0% FCS) for 4 hours. pMLC2 was detected by a phospho specific antibody. Total MLC2 and β-actin served as loading controls. Numbers below the lanes reflect relative levels of phosphorylated MLC2 normalized to total MLC2 as determined by densitometry.

