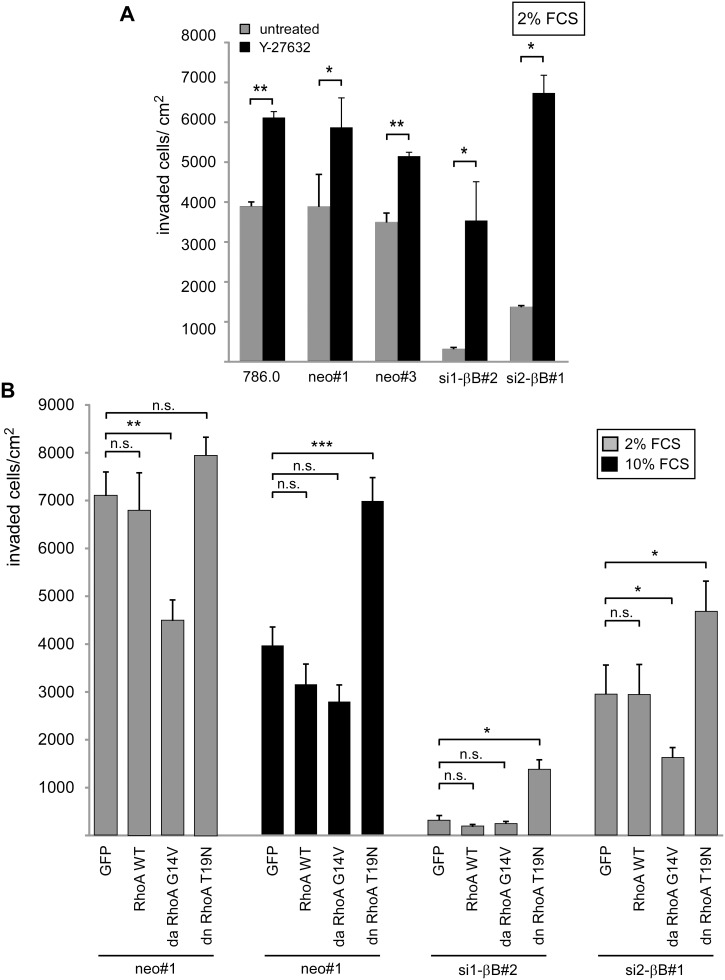
Figure 5. The RhoA pathway interferes with invasiveness of ccRCC cells.
(A) Parental 786.0, neo control clones and Activin B knockdown clones were plated in the presence of 2% FCS on collagen I gels and treated with the Rho-Kinase inhibitor Y-27632 (black bars) or left untreated (grey bars). Number of invaded cells was quantified after 3 days. (B) Stable pools expressing either EGFP, wildtype, dominant active (G14V) and dominant negative (T19N) RhoA, respectively, were plated in the presence of 2% FCS (grey bars) or 10% FCS (black bars) on collagen I gels. Invaded cells were quantified after 3 days. Bars represent the mean of three independent experiments, error bars indicate standard deviation. Statistical significance was determined by Student’s t-test (5A) and ANOVA analysis (5B) and denoted by asterisks: *P<0.05; **P<0.01; ***P<0.001; n.s. not significant.

