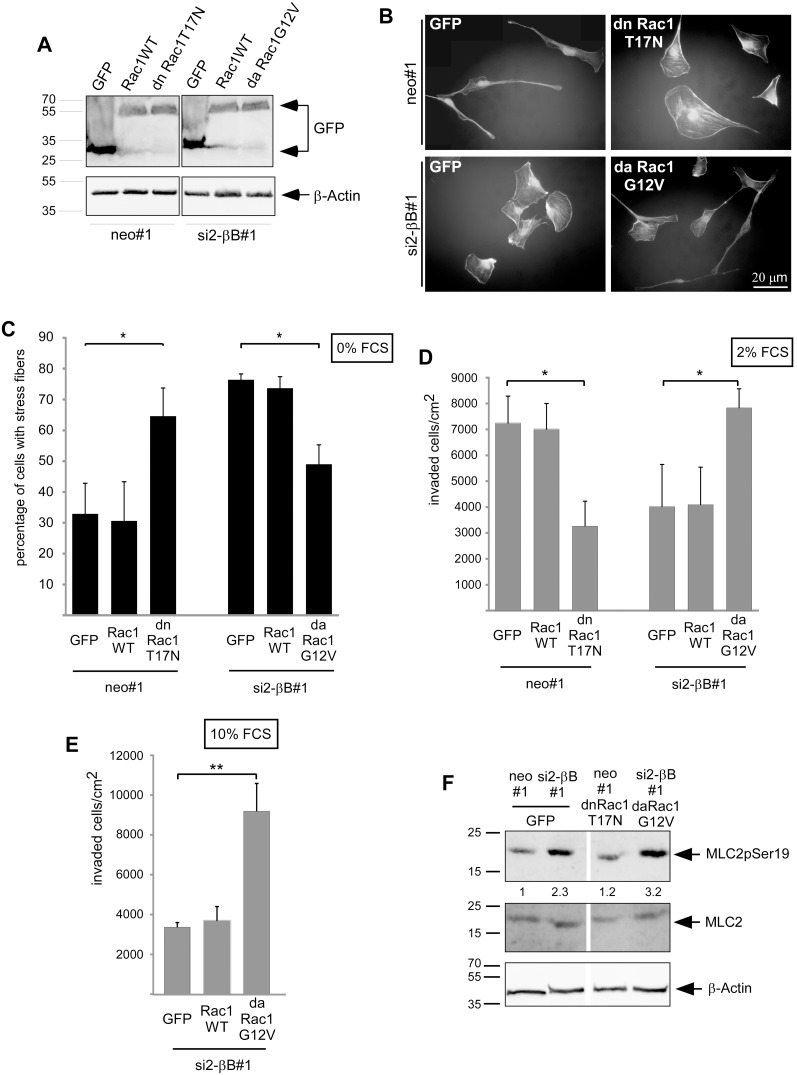
Figure 6. Opposite roles for Rac1 and RhoA in Activin B dependent invasion and actin rearrangement.
(A) Generation of pools of the neo#1 clone and of the si2-βB#1 Activin B knockdown clone stably transfected with EGFP empty vector, expression constructs for GFP-tagged wildtype Rac1, dominant active Rac1 (G12V) or dominant negative Rac1 (T17N). Expression of EGFP and GFP-tagged Rac1 proteins was confirmed by Western Blotting. (B) TRITC-labeled Phalloidin staining of the indicated pools after serum starvation (0% FCS) for 3 hours. (C) Quantification of cells with actin stress fibers upon serum starvation for 3 hours. (D) and (E) The indicated pools were plated in the presence of 2% FCS (D) or 10% FCS (E) on collagen I gels and the number of invaded cells was quantified after 3 days. (F) Phosphorylation of MLC2 (Myosin light chain 2) at Serin 19 in 786.0 pools expressing either EGFP or the indicated Rac1 proteins was determined by Western Blotting. Cells were serum starved (0% FCS) for 4 hours. pMLC2 was detected by a phospho specific antibody. Total MLC2 and β-actin served as loading controls. Numbers below the lanes reflect relative levels of phosphorylated MLC2 normalized to total MLC2 as determined by densitometry. Bars in C, D and E represent the mean of three (C) and four (D; E) independent experiments, error bars indicate standard deviation. Statistical significance was determined by ANOVA analysis and denoted by asterisks: *P<0.05; **P<0.01.

