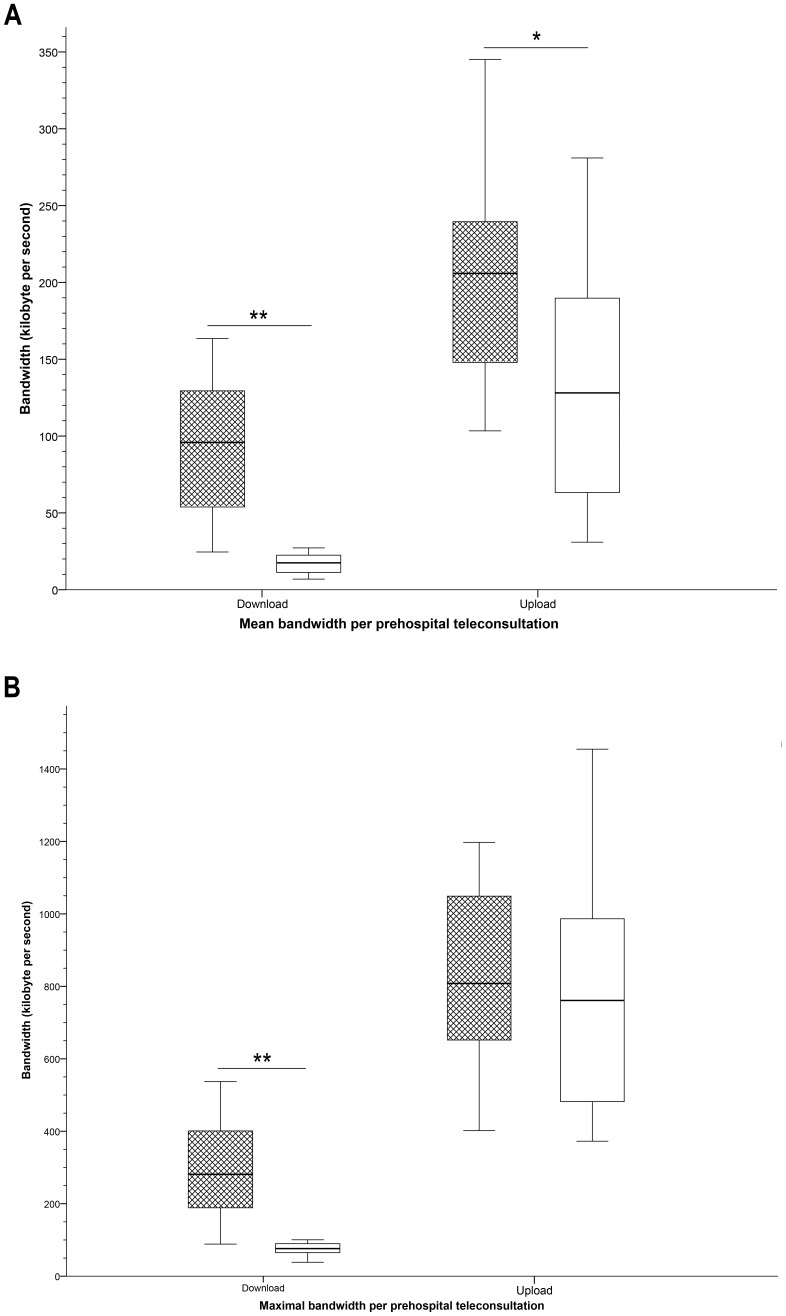
Figure 3. Box-and whisker plots demonstrating bandwidth per prehospital teleconsultation.
Box-and whisker plots demonstrating mean (A) and maximal (B) bandwidth per prehospital teleconsultation for download (from the ambulance to the teleconsultant) and for upload (from the teleconsultant to the ambulance). Hatched boxes represent teleconsultations outside of office hours; white boxes teleconsultations during office hours. Significant differences are indicated with * (P<0.05) or with ** (P<0.001).

