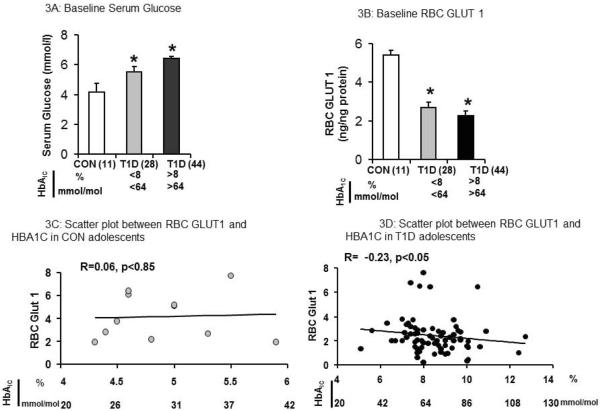
Figure 3. Serum Glucose and RBC GLUT1 in CON and T1D comparing HbA1C <8% (64 mmol/mol) and HbA1C >8(64 mmol/mol).
3A:Baseline serum glucose (mmol/L) in CON (n=11), T1D with HbA1C <8% (<64mmol/mol, n=28)) and HbA1C >8% (>64 mmol/mol, n=44)), 3B: RBC GLUT1 (ng/ng protein) in CON (n=11), T1D with HbA1C <8 (<64 mmol/mol, n=28) and HbA1C >8% (>64 mmol/mol, n=44), 3C: Scatter plot between RBC GLUT1 and HbA1C in CON (n=11) showing no correlation and 3D: Scatter plot between RBC GLUT1 and HbA1C in T1D (n=72) showing lower serum HbA1C levels resulting in higher baseline RBC GLUT1 concentrations in T1D adolescents (n=72) (R=0.23, p<0.05).

