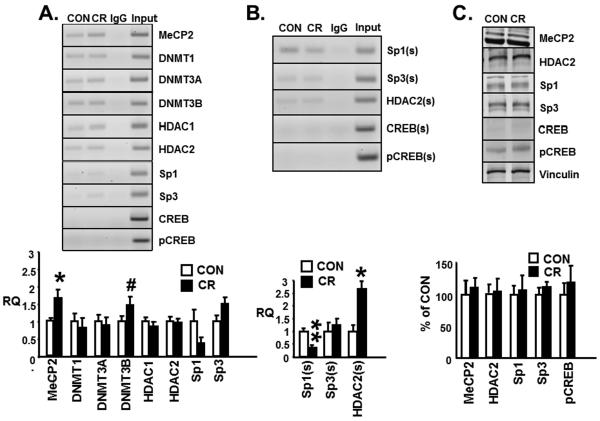
Figure 4.
A. Representative 2% agarose gels (top panel) demonstrate the glut3 5'-flanking region that contains the CpG island amplified by PCR (239 bp) from chromatin immunoprecipitation (ChIP) assays conducted in control (CON) and calorie restricted (CR) placentas in the presence of specific antibodies (anti-MeCP2, Dnmt1, Dnmt3a, Dnmt3b, HDAC1, HDAC2, Sp1, Sp3, CREB and pCREB; n=6–13/group), non-specific antibody (IgG) or no antibody (input). B. Sequential ChIP was conducted in control (CON) and calorie restricted (CR) placentas first with the anti-MeCP2 antibody followed by anti-Sp1, Sp3 or HDAC2, CREB and pCREB antibodies denoted by (s). ChIP (A) or sequential ChIP (B) followed by real time quantitative PCR denoted as relative quantification (RQ) and shown as a fraction of the corresponding CON group which assessed the recruitment of various nuclear proteins as depicted in bar graphs (bottom panels), n=3,9,12/group.*p<0.05, **p<0.001 and #p<0.1 (not significant) compared to the corresponding control group. C. Representative Western blots demonstrating the MeCP2, HDAC2, Sp1, Sp3, CREB and pCREB with vinculin (internal loading control) protein bands (top panel) and the quantification depicted in the bar graph (bottom panel) as a ratio to vinculin and presented as a percent of the corresponding CON group (n=6–8/group).

