
Figure 1.
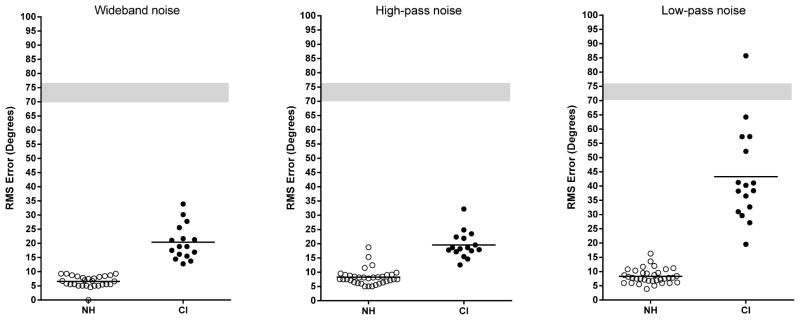
Localization accuracy for normal hearing listeners and CI listeners. The left, middle and right panels show results for wideband, high-pass and low-pass signals, respectively. The horizontal bars indicate the group mean scores. The grey zone indicates +/− 1 standard deviation for chance performance.