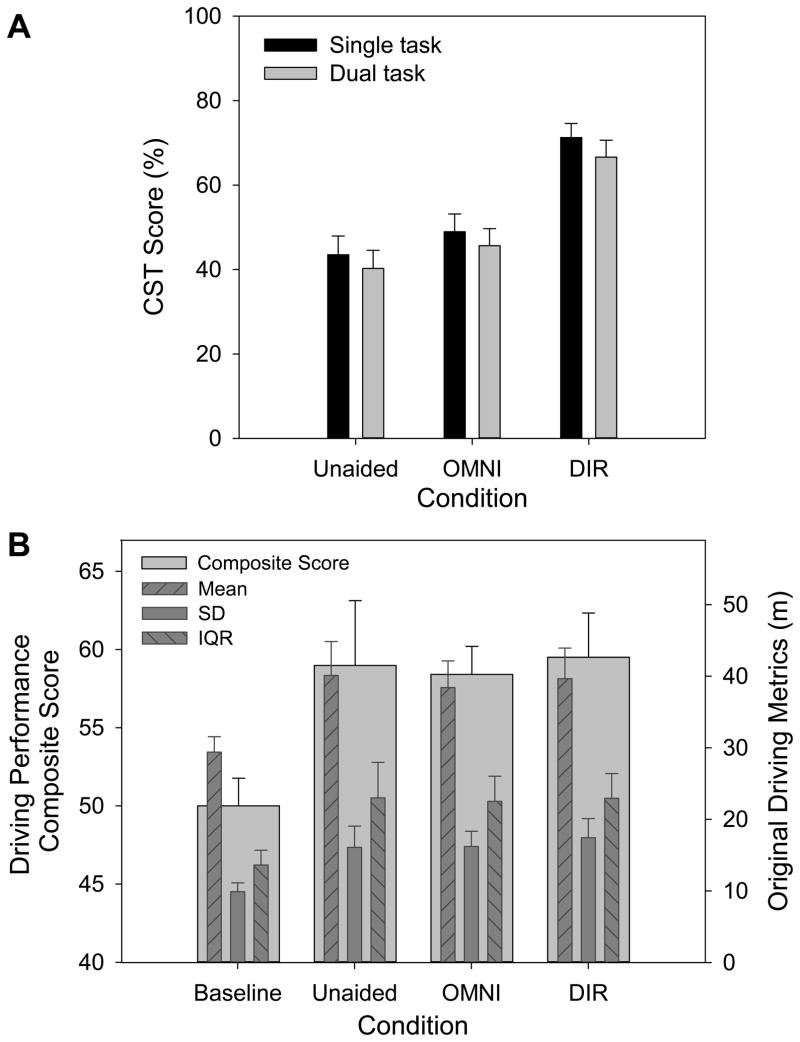
Figure 2.
A: CST score as a function of test condition in Experiment 1. Higher scores reflect better speech recognition performance. B: Driving performance composite score (refer to the left y-axis) and the three original driving metrics (mean, SD, and interquartile range (IQR) of the following distance in meters; refer to the right y-axis) as a function of test condition. Higher scores reflect poorer driving performance. Error bars = 1 SE.

