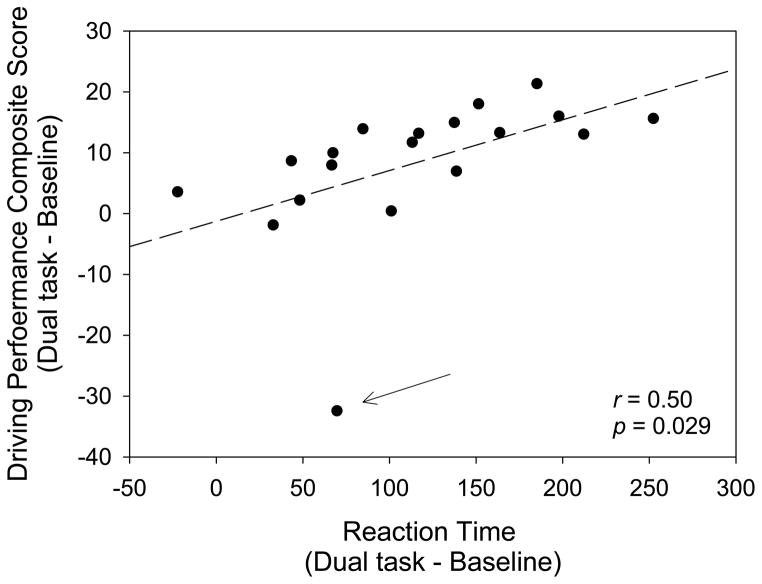
Figure 4.
Relationship between listening effort measured using the driving (Experiment 1) and visual reaction-time tasks (Experiment 2). The data are the average of the three difference scores between each dual-task hearing aid condition (Unaided, OMNI, and DIR conditions) and Baseline condition. The arrow indicates an outlier.

