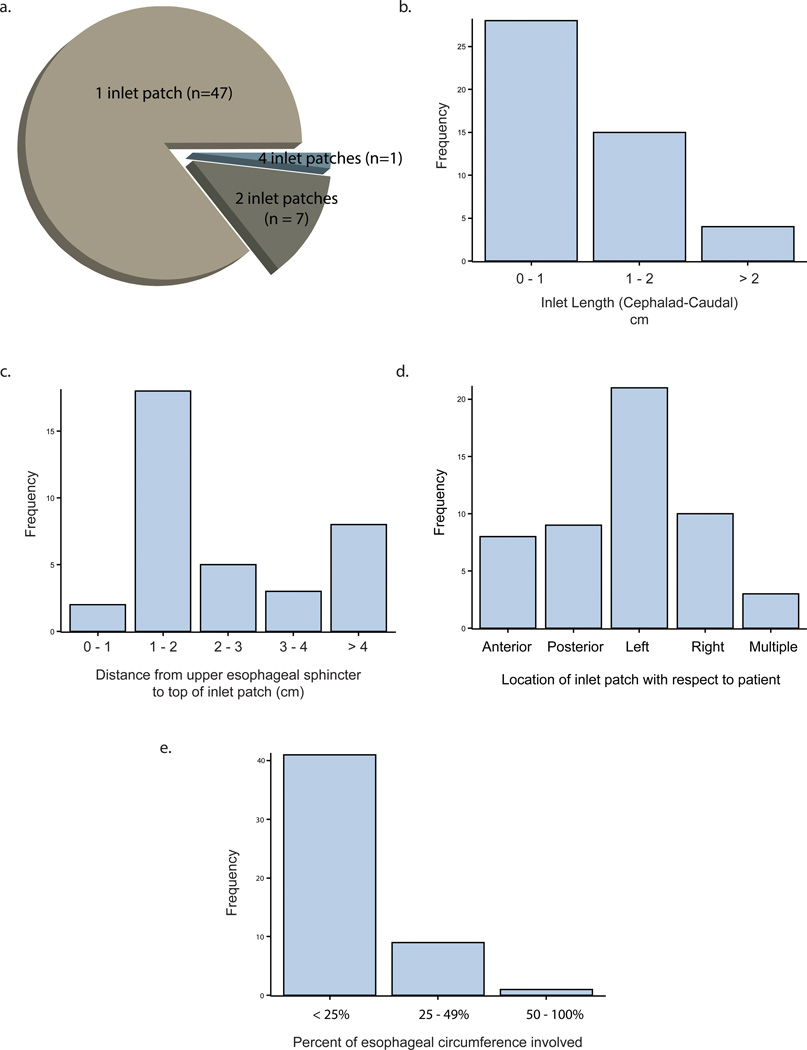
Figure 1.
Characteristics of the inlet patch findings. A pie chart of the number of inlet patches found per patient is located in panel a. Panel b shows a histogram (absolute counts) of the inlet patch length from proximal to distal edge in centimeters. Panel c shows the distance from the upper esophageal sphincter to the proximal edge of the patch in centimeters. Panel d shows the distribution of the patch location, with respect to the patient. Finally, panel e shows the percentage circumference that the patch encompasses in this population.

