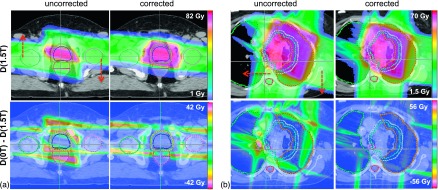
FIG. 5.

Dose distributions for (a) patient 2 and (b) patient 5 at 1.5 T field (top left). The directions of beam isocenter shifts are shown by arrows. The dose distributions after beam repositioning are compared (top right). The dose differences (nominal vs 1.5 T) without (bottom left) and with corrections (bottom right) show improved target conformity after implementing the plan corrections.
