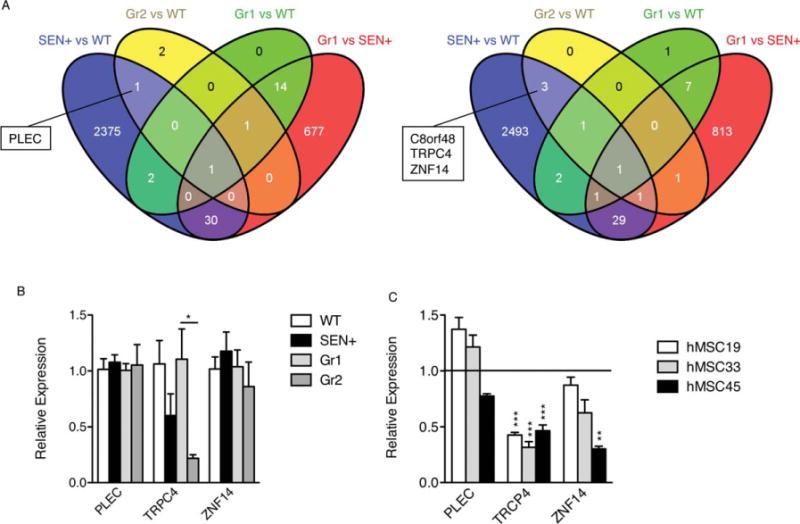
Figure 7.

Four genes in the microarray analyses appear selectively regulated in both senescent and therapeutically ineffective hMSCs. We searched for genes differentially upregulated or downregulated in both SEN+ and Gr2 samples (therapeutically ineffective) compared with WT samples, but not differentially expressed in Gr1 (therapeutically effective) compared with WT or SEN+ samples. (A): Venn diagrams show the number of RNA probes differentially expressed (adjusted p < .05) in each cell population, analyzed with the Agilent Whole Human Genome Microarray Kit. For SEN+ and WT, n = 4; for Gr1, n = 5; for Gr2, n = 3. (B): Relative expression levels of PLEC, TRPC4, and ZNF14 (endogenous control GAPDH) measured by real-time RT-PCR. The samples used were the same as those used for the microarray analysis. WT (average) was used as a calibrator for SEN samples, and Gr1 (average) was used as a calibrator for Gr2 samples. (C): Relative expression levels of PLEC, TRPC4, and ZNF14 (endogenous control GAPDH) measured by real-time RT-PCR in three different isolates of replicative-senescent hMSCs. *, p < .05; **, p < .01; ***, p < .005, versus presenescent samples. Error bars represent SEM (n = 3). Abbreviations: hMSC, human mesenchymal stem cell; WT, wild type.
