
Figure 4.
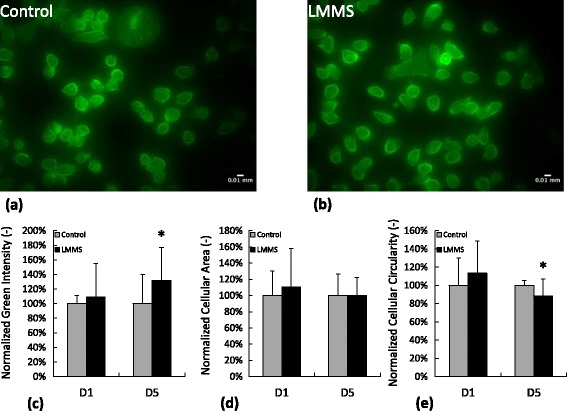
Phalloidin staining and morphology of MDA-MB-231 cells for control and LMMS groups for experimental days 1 and 5. Representative micrographs from a) control and b) LMMS group. Individual cells were analyzed for c) mean green intensity, d) cellular area and e) cellular circularity. (*: p < 0.05 between LMMS and controls).