
Figure 4.
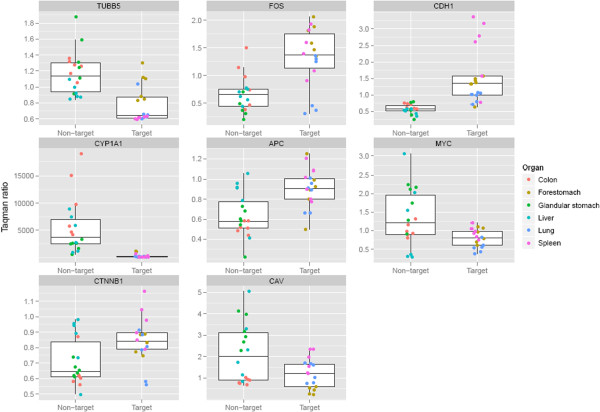
Boxplots of the eight genes found to be modulated significantly differently between target and non-target organs (p < 0.05; Benjamin-Hochberg multiple testing correction applied). Expression values were normalised to the corn-oil control for each organ and pooled according to target or non-target status. Each organ is identified by colour. The box indicates the median, upper and lower quartiles and the whiskers are 1.5 times IQR (interquartile range; Q3-Q1) above/below the box.