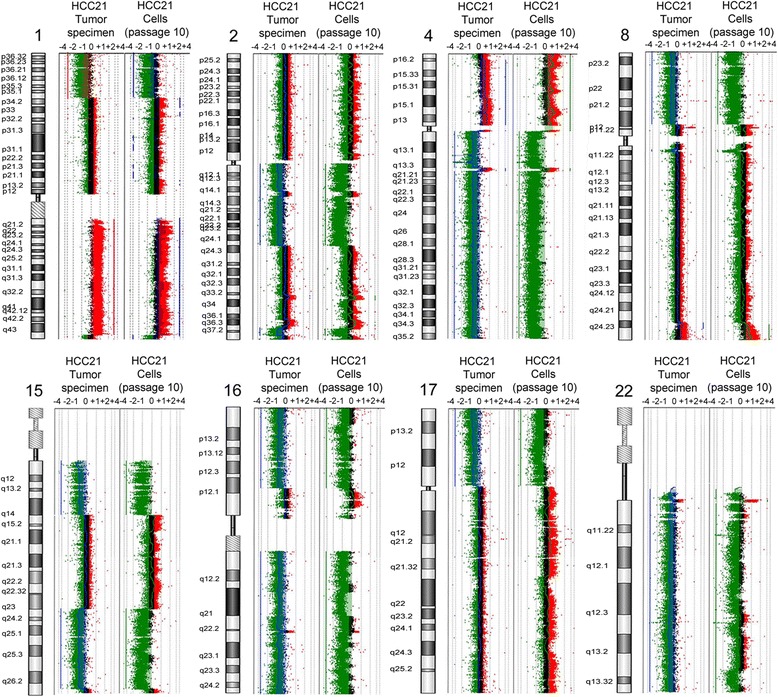
Figure 5.

CGH analysis of HCC21 cells and the original tumor. Vertical profiles of chromosomes 1, 2, 4, 8, 15, 16, 17 and 22 are shown with a log2 ratio, which represents the difference between tumor and normal DNA copy number. Ratio of 0 indicates that there is no change in copy number between tumor and normal cell DNA. Positive and negative log2 ratios indicate the gain and loss of tumor DNA copy number, respectively. The left panel of each plot represents the chromosome of the original clinical tumor specimen, while the right panel represents that of HCC21 cells at passage 10.
