
Figure 6.
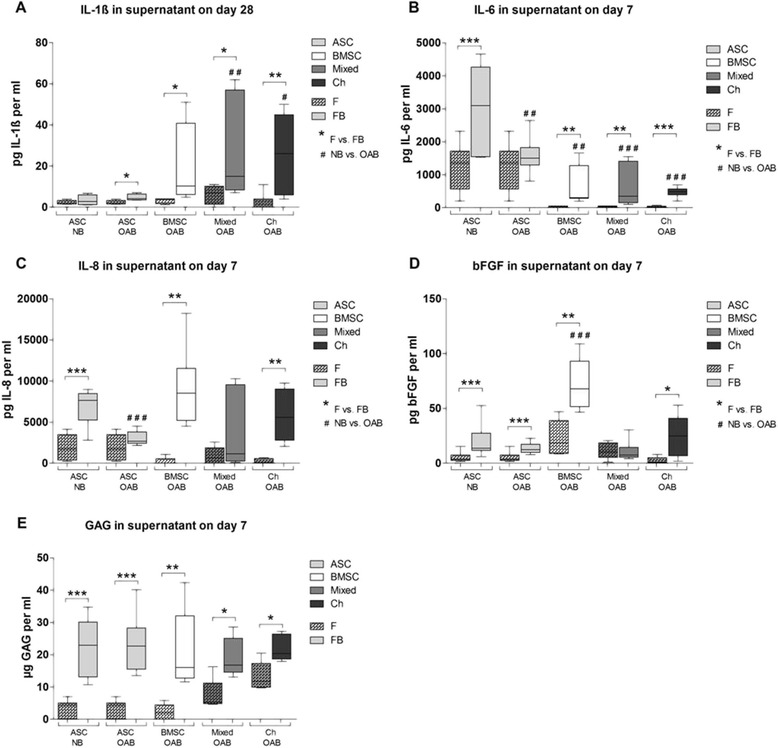
Quantification of cytokines, bFGF and GAGs in culture supernatants. Analysis of supernatants at days 7 or 28 of ASC (light grey bars), BMSC (white bars), mixed cultures (BMSC and chondrocytes in a ratio of 1:1, dark grey bars) or chondrocytes (black bars) monocultured (F, bars with pattern) and co- or tricultured with NB or OAB explants (FB, blank bars). Total amounts of cytokines (A) IL-1ß, (B) IL-6, (C) IL-8), (D) bFGF released into the supernatant were quantified by antigen-specific ELISAs. Analysis of soluble GAG was carried out using a DMMB-assay containing a chondroitin sulfate standard curve for quantification (E). Stars (*) indicate significant differences between mono- and cocultures, hash signs (#) indicate significant differences between NB and OAB cocultures. Results are mean with standard deviation (SD). N =6; * P <0.05, ** P <0.01, *** P <0.001. bFGF, basic fibroblast growth factor; BMSC, bone marrow-derived mesenchymal stem cells; DMMB, dimethylmethylene blue; ELISA, enzyme-linked immunosorbent assay; F, fibrin gel-embedded monocultures (without subchondral bone explants); FB, fibrin gel-embedded co- and tricultures together with subchondral bone explants; GAG, glycosaminoglycan; NB, normal subchondral bone; OAB, osteoarthritic subchondral bone.