
Figure 5.
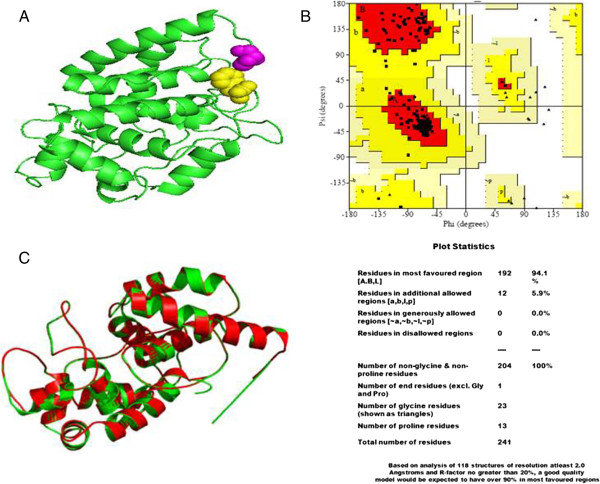
3D structure of Ta pAPX protein. Showing N-terminal (pink colour) and C-terminal (yellow colour) (A). Ramachandran plot of TapAPX protein revealing 94.1% residues located in the most favored regions and 5.9% residues in semi allowed region (B). Superimposed model of generated protein structure of TapAPX under study (green) against its template 2XIF (red) (C).