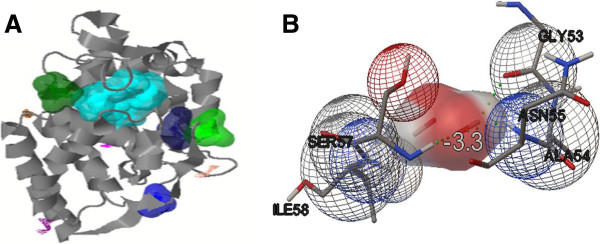
Figure 6.

Active sites and interaction of receptor-ligand. Model of generated TapAPX protein showing ten active sites by Q-SiteFinder tool (in different colours) containing different amino acid residues. First five active sites shown in space fill (A). Molecular interaction studies between TapAPX model and substrate H2O2 by Autodock vina software. Green dots represent the Hydrogen bonding between ASN55 and SER57 (B).
