Figure 1.

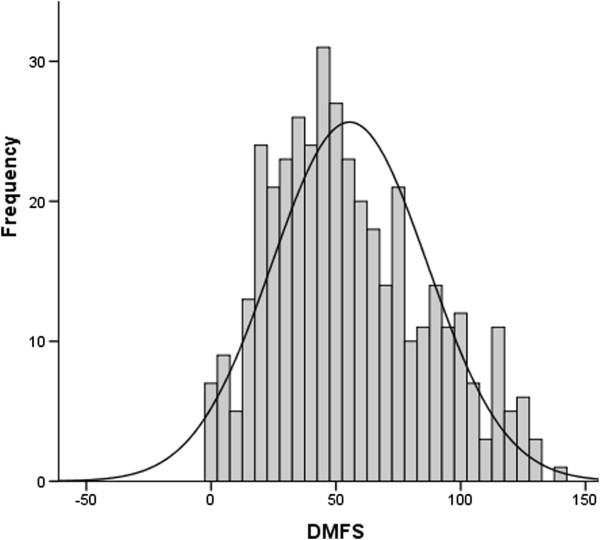
Caries prevalence (DMFS total ) distribution. The histogram involves all study subjects (n = 400) at baseline 2005. Mean DMFS was 55.5 (95% CI, 52.4-58.5). The solid line represents the fitted normal distribution curve.

Caries prevalence (DMFS total ) distribution. The histogram involves all study subjects (n = 400) at baseline 2005. Mean DMFS was 55.5 (95% CI, 52.4-58.5). The solid line represents the fitted normal distribution curve.