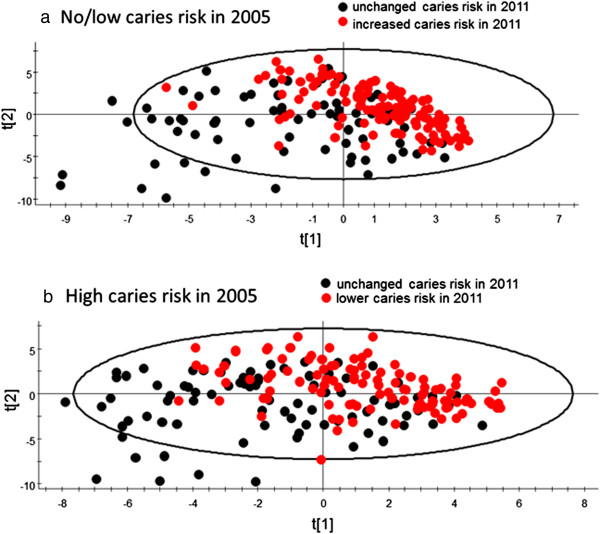
Figure 6.

PCA clustering of subjects by alteration in caries risk scoring over the seven-year study period. PCA score plots clustering subjects who (a) did or did not maintain their caries risk score over the seven-year study period if having low/no risk in 2005 or (b) who did or did not improve their caries risk score over the seven-year study period if having high risk in 2005. The model explanatory power (R2) was 33.5% and 32.4% for a) and b), respectively, and the predictive power (Q2) was 22.1% and 24.0% for a) and b), respectively.
