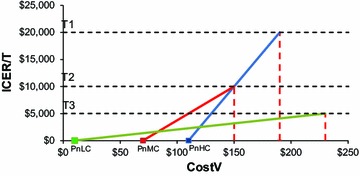
Fig. 2.

Cost neutral (Pn) and maximum price (Pm) at different thresholds and slope lines. The green line indicates a country with a low threshold (T3), the red line a country with an intermediate threshold (T2), and the blue line a country with a high threshold (T1). As the threshold increases the cost neutral point (where the line intercepts the x-axis) shifts to the right and the slope steepens, reflecting higher healthcare expenditure and lower remaining disease burden. CostV vaccine cost, ICER incremental cost-effectiveness ratio, P nHC cost neutral price in high-income country, P nLC cost neutral price in low-income country, P nMC cost neutral price in middle-income country, T threshold
