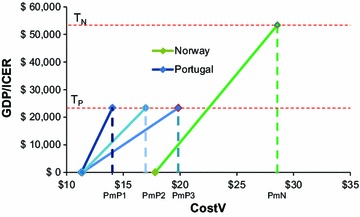
Fig. 4.

Effect on the maximum price (Pm) of increasing the threshold (GDP in Norway compared with Portugal) and increasing the disease burden (number of rotavirus deaths per year in Portugal increased from P1 to P2 to P3). CostV Vaccine cost, GDP gross domestic product, ICER incremental cost-effectiveness ratio, Pm maximum price, T N threshold for Norway, T P threshold for Portugal
