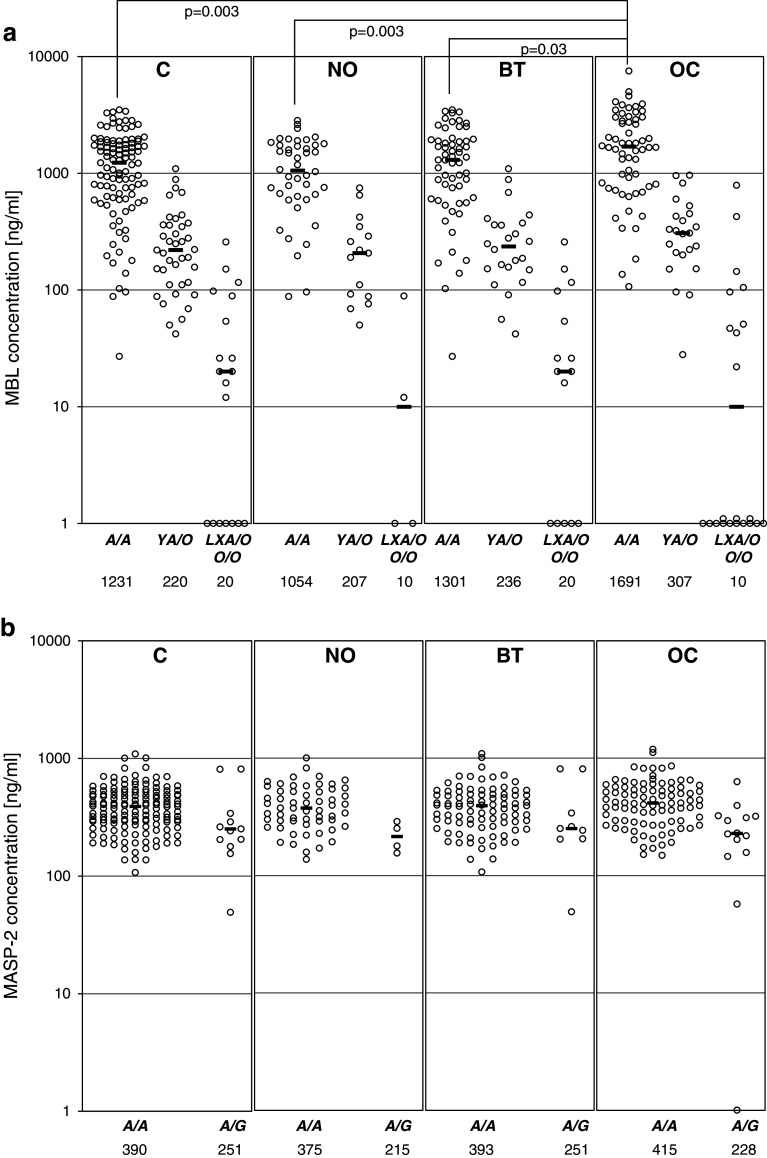
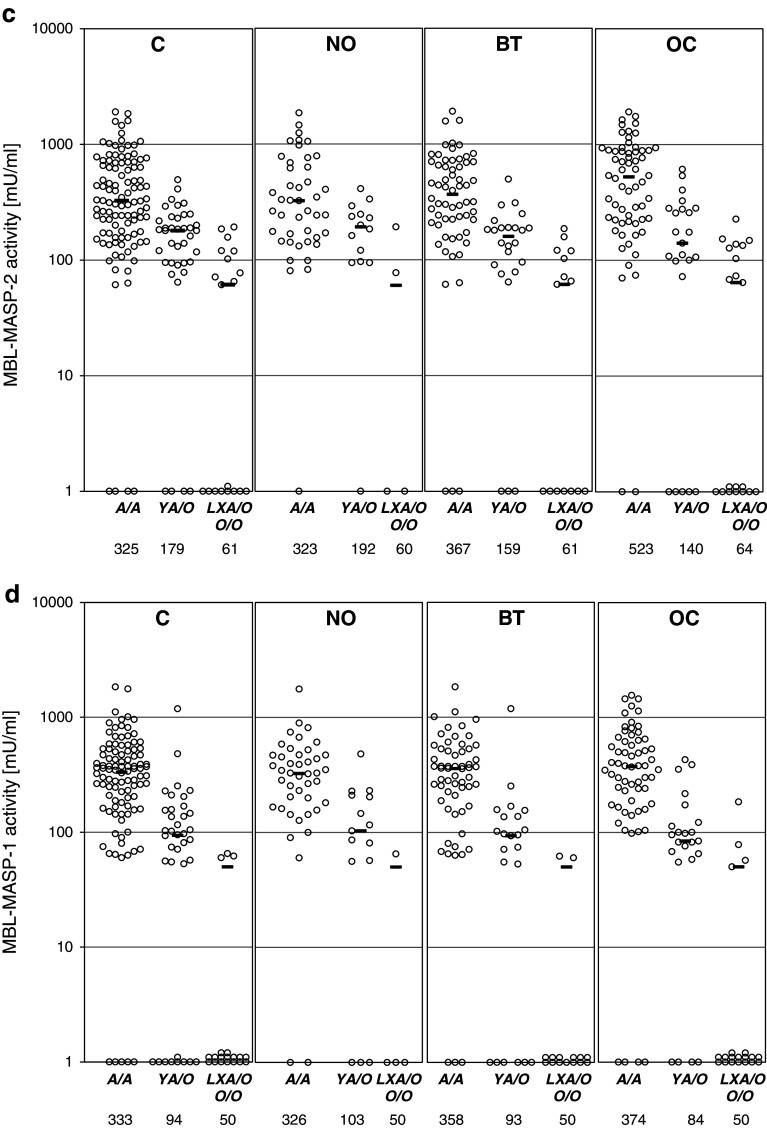
Fig. 2.
a Individual MBL serum concentrations, depending on MBL2 genotypes; b individual MASP-2 serum concentrations, depending on MASP2 genotypes; c individual MBL–MASP-2 serum activities, depending on MBL2 genotypes; d individual MBL–MASP-1 serum activities, depending on MBL2 genotypes. C, combined control group; NO, women with normal ovaries; BT, patients with benign ovarian tumours; OC, patients with primary ovarian cancer. Values below the detection limit are presented as “1”. Bars indicate median values (presented by numbers below corresponding genotypes). When the majority of values were under the detection limit, medians were marked at that level


