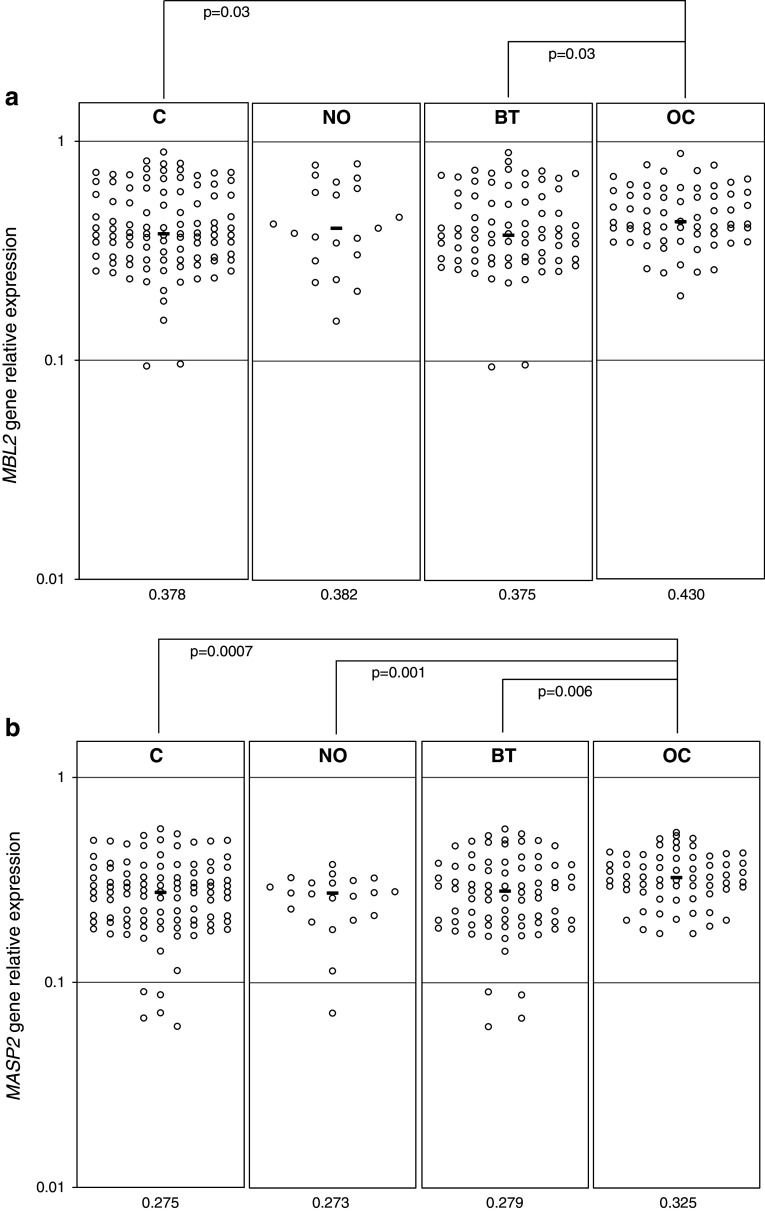
Fig. 3.
Expression (at the mRNA level) of MBL2 (a) and MASP2 (b) genes in ovarian section samples. C, combined control group; NO, women with normal ovaries; BT, patients with benign ovarian tumours; OC, patients with primary ovarian cancer. Bars indicate median values (presented by numbers below corresponding genotypes)

