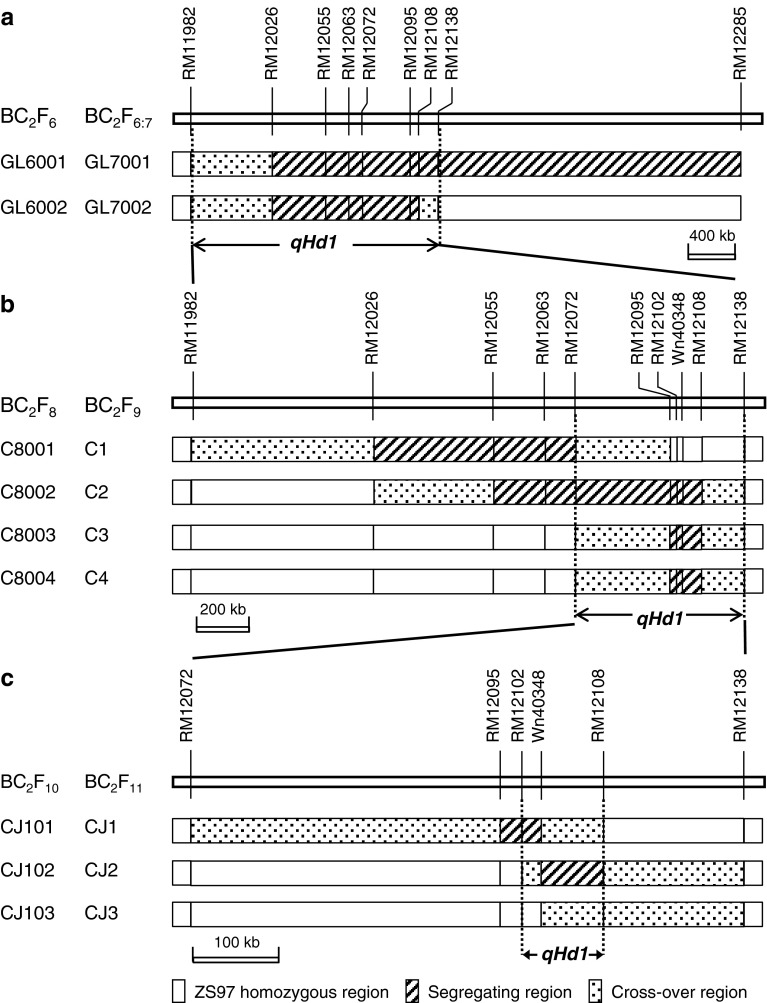
Fig. 2.
Segregating populations used for mapping qHd1, showing sequential segregating regions in each generation and the delimitation of qHd1 to a 95.0-kb region flanked by RM12012 and RM12108. a Two sets of BC2F6 and BC2F6:7 populations; b four F2-type populations in BC2F8 and four sets of near isogenic lines in BC2F9; c three F2-type populations in BC2F10 and three sets of near isogenic lines in BC2F11

