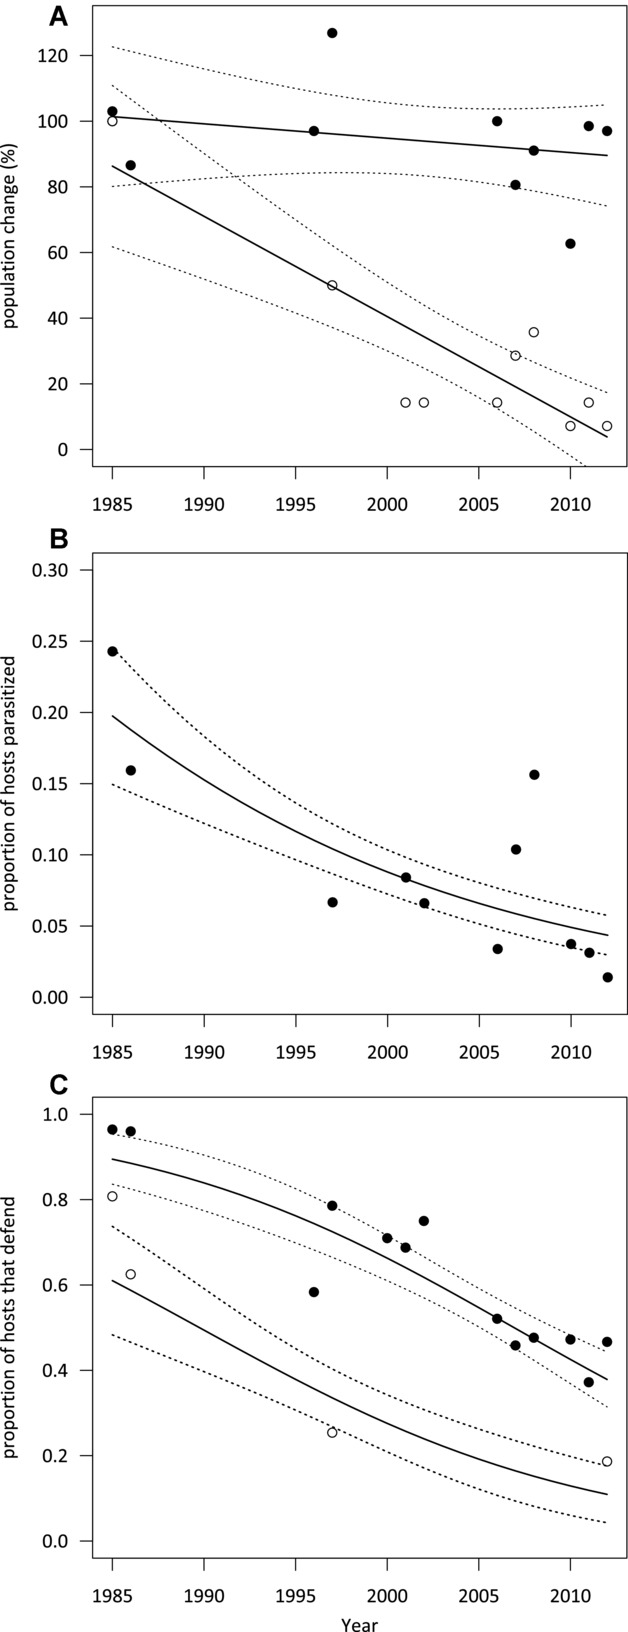
Figure 1.

Changes in (A) population sizes (1985 scored as 100%) of reed warbler hosts (black circles) and female cuckoos (white circles); (B) parasitism rate; and (C) host defenses (mobbing of adult cuckoos, black circles, and rejection of non-mimetic eggs, white circles) at Wicken Fen, Cambridgeshire, U.K., from 1985–2012. Lines of best fit (± SE) come from linear regressions (A), or binomial generalized linear models (B, C). See Table S1 for raw data.
