
Figure 3.
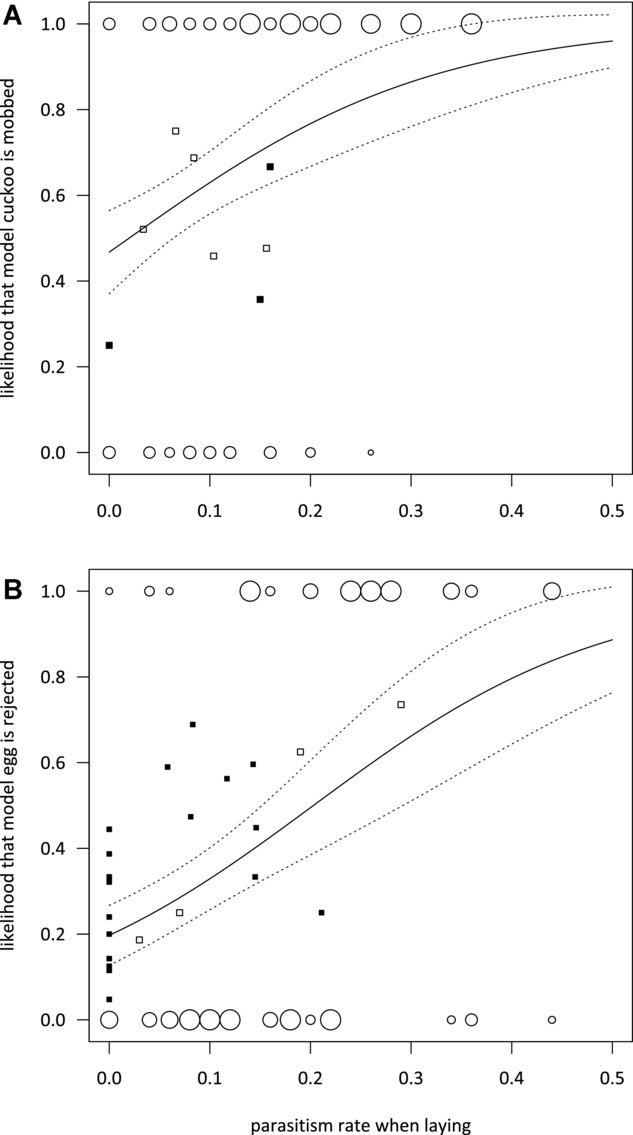
Variation in defenses by reed warblers on Wicken Fen in response to parasitism rate at the time of laying, as predicted by a generalized linear model with binomial errors (solid line, dashed lines ± SE) of (A) mobbing of adult cuckoo models at the nest (not mobbed (0) or mob (1), n = 205 nests from 1985 to 1986, 1996 to 1997, 2010 to 2011) and (B) acceptance (0) or rejection (1) of nonmimetic model eggs (n = 201 nests from 1985 to 1986, 1997, 2012). The relative sizes of pairs of data points (open circles) show the proportion of birds that did or did not defend themselves. Also plotted are the data for geographic variation in reed warbler defenses at various populations across Europe: black squares represent population-level estimates of mobbing or egg rejection at varying parasitism rates from other study sites (see Table S3 for details). Population-level data from different years on Wicken Fen were not used to investigate fit of other populations, but are presented here for comparison (white squares).