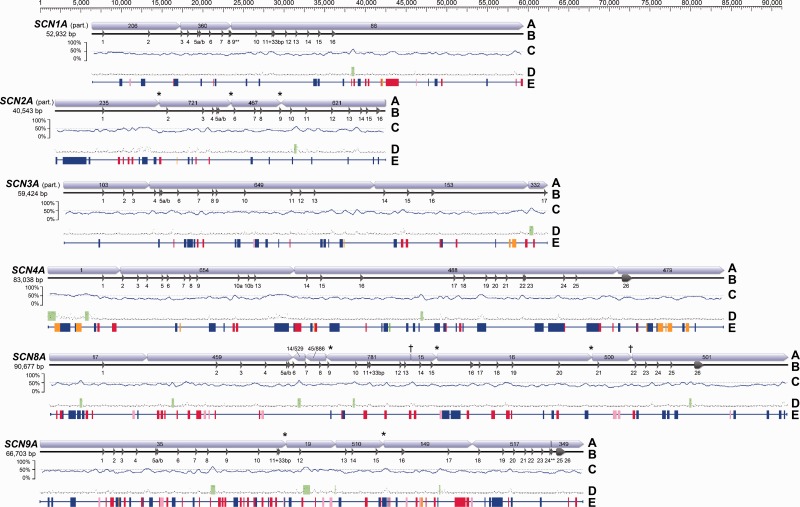
Fig. 1.
Gene structure for the six SCNA paralogs detected using BAC library scanning. To facilitate comparison, genes are aligned by the start codon in exon 1. Total base pair length represents the concatenated length of the contigs shown and may include untranscribed regions. (A) Concatenated contigs from 454 sequencing. (* indicates that contigs share an edge; † indicates that two contigs share an edge with a third small contig.) (B) Exon/intron structure. Partial CDS was obtained for three paralogs. (** indicates an incomplete exon.) (C) GC content using a 500-bp sliding window. (D) CpG islands (green) predicted by Geneious. (E) Simple repeats or TEs identified by Censor (green = satellite; red = DNA transposon; pink = endogenous retrovirus; orange = LTR retrotransposon; blue = non-LTR retrotransposon).

