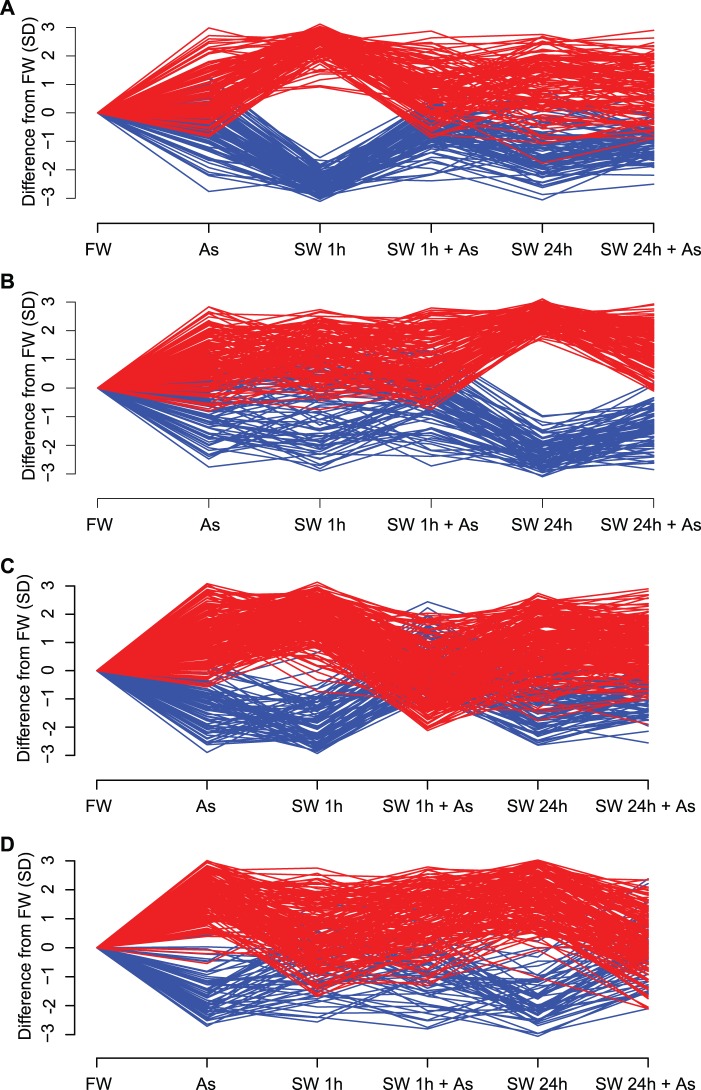
Fig. 1.
Arsenic–seawater interactions reveal phenotypic plasticity-enabling genes. Differences in gene expression (GE) from gill tissue of four male killifish, Fundulus heteroclitus, for each of six treatments were analyzed by measuring quantile normalized log2 expression values using a two-factor linear model that includes two categorical variables (presence of arsenic and time spent in seawater) as well as their interactions. DE genes were defined by P values < 0.05 and fold changes >2 for at least one treatment. The y axis shows differences in GE from freshwater (FW) in units of SD for (A) genes significantly DE at 1 h, (B) genes significantly DE at 24 h, (C) genes with significant interactions between arsenic and salinity at 1 h, and (D) genes with significant interactions between arsenic and salinity at 24 h. Genes upregulated compared with FW appear in red; down in blue. DE genes at 1 h (A) and 24 h (B) diverge from FW, yet the divergence at 1 h (A) is not seen at 24 h (A). Arsenic’s inhibition of gene expression associated with salinity acclimation is seen by observing the interaction gene sets. DE genes of the two treatments, arsenic–seawater 1 h (C) and arsenic–seawater 24 h (D), deviate from expectations of additivity. For example, the arsenic–seawater 1 h DE genes (C) respond to both arsenic and 1 h seawater treatments when compared with FW. An additive model predicts that the combined effect of both arsenic (As) and seawater acclimation at 1 h (SW 1 h) should result in a greater (red) or lesser (blue) GE response (As + 1 h SW). However, this combined effect produces an antagonistic interaction GE pattern that is similar to that observed in a stable environment (FW). Genes showing interaction effects at 24 h (D) recapitulate this pattern.

