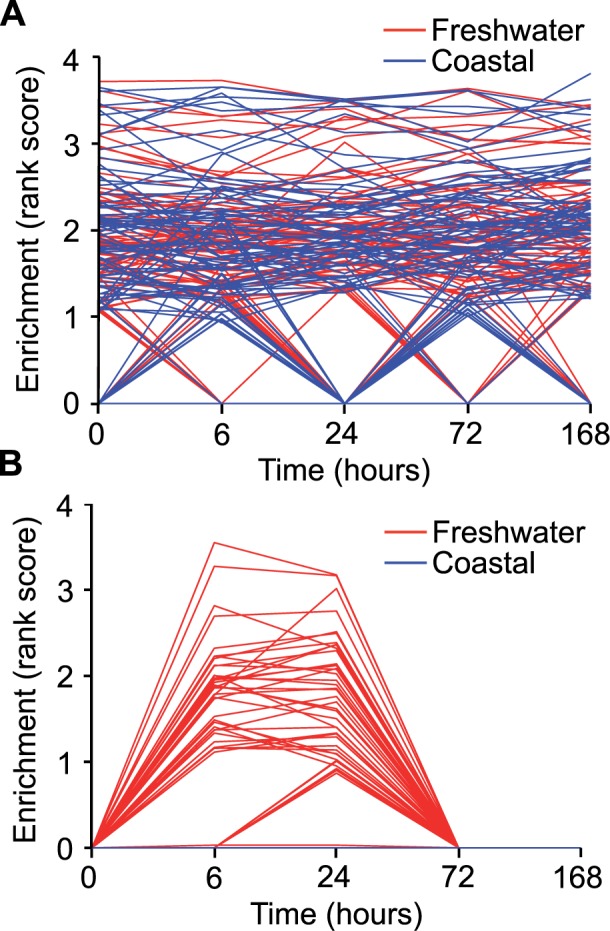
Fig. 3.

GSEA reveals general plastic response of interaction genes. GSEA (Subramanian et al. 2005) was used to investigate local enrichments of the main effects gene set and interaction gene sets across time (0, 6, 24, 72, and 168 h) in the freshwater and coastal populations reported in Whitehead et al. (Whitehead et al. 2011). For these analyses, the data from Whitehead et al. were ranked by mean expression value for each time point within a population and time point, and enrichment by the interaction or main effects gene sets identified in the current manuscript interrogated. For gene sets exhibiting significant enrichment, the Enrichment Rank Scores for genes from the comparison group (i.e., interaction, main effects) that were overrepresented in the top or bottom of these sets (i.e., the leading-edge subsets) that account for a gene set’s enrichment signal are provided as individual lines for seawater 1 h (A) and arsenic–seawater 1 h interactions (B) treatments. These are plotted across time points (0 h, seawater control, through 168 h in freshwater) for populations living in coastal (blue) and freshwater (red) environments. These plots reveal that only fish from the freshwater population (red) shared similar expression patterns with the interaction gene sets (B) during early acclimation (6 and 24 h).
