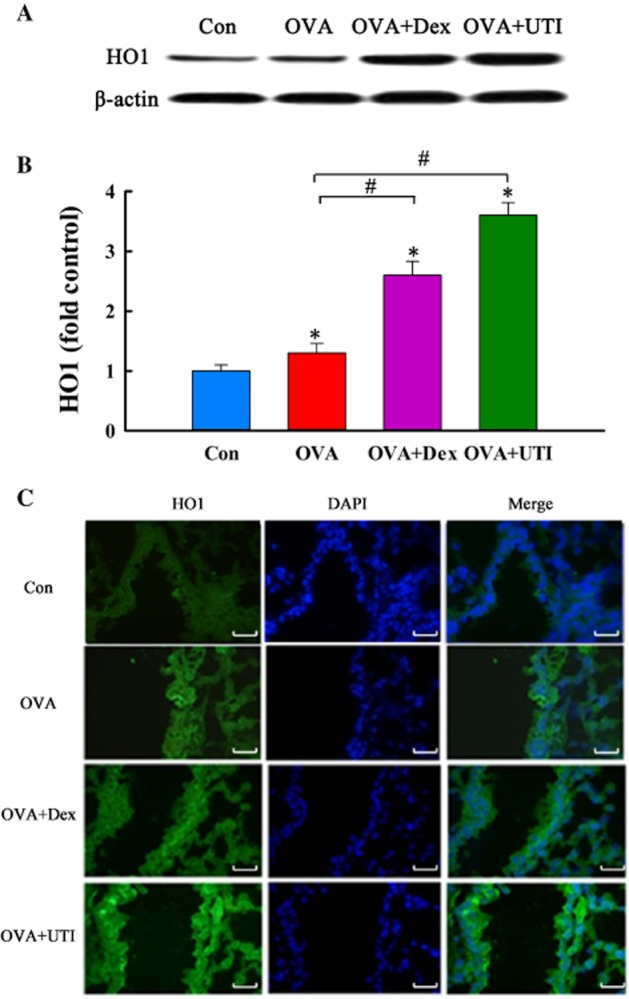
Figure 6.

UTI augments OVA-induced HO1 protein expression. At 24 h after final OVA challenge, lung tissue level of HO1 protein was determined. (A) Western blot photographs show that UTI or Dex augments OVA-induced HO1 protein expression. (B) Western blot HO1 bands were quantified using densitometry and expressed as fold increase over control group. Means ± SD of five mice per group. *P < 0.05, compared with control group. #P < 0.05, compared with OVA alone group. (C) Representative photographs of immunofluorescence staining show UTI increases HO1 expressing cells. Lung cryosections were prepared 24 h after final OVA challenge, and immunofluorescence stained with HO1 antibody and nuclear counterstained with DAPI. Specificity of HO1 staining was confirmed using isotype control antibody. OVA sensitization and challenge caused an increase, and OVA + UTI caused a further increase in number of HO1 positive cells. Scale bar = 20 μm.
