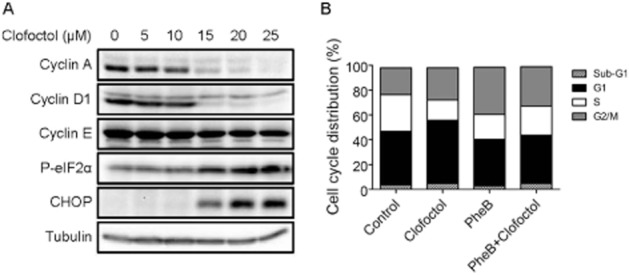
Figure 6.

Clofoctol decreases G1/S cyclin levels. (A) PC3 cells were treated with indicated concentrations of clofoctol for 24 h. Cells were then harvested for Western blot analysis of cyclin A, cyclin D1, cyclin E, phosphorylated eIF2α and CHOP. (B) PC3 cells were treated with clofoctol and/or phenylbutyrate (PheB) for 24 h. The cells were then harvested and subjected to a cell cycle analysis. The % of cell population in each cell cycle phase is shown as a bar graph.
