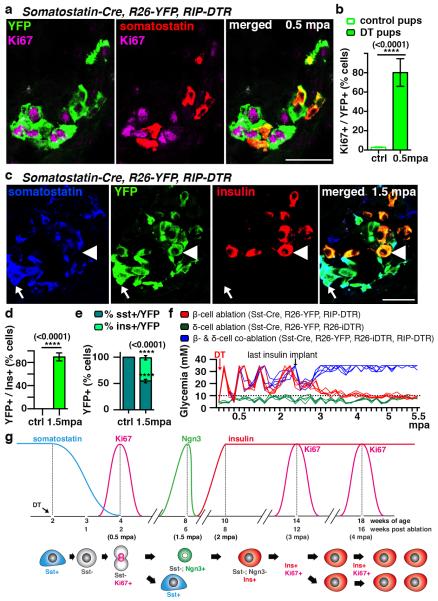
Figure 2. δ-cells dedifferentiate, proliferate and reprogram into insulin production after extreme β-cell loss in Somatostatin-Cre; R26-YFP; RIP-DTR juvenile mice.
a) Immunofluorescence for YFP and Ki67 at 0.5 mpa. b) 80% of somatostatin-traced YFP+ cells are Ki67+ after β-cell-ablation (controls: n=6, 2,754 YFP+-cells scored; DT: n=6; 3,146 YFP+-cells scored; Welch’s test [p<0.0001], Mann-Whitney [p=0.0022]). c, d) At 1.5 mpa 90% of insulin+ cells coexpress YFP (controls: n=3, 6,480 insulin+-cells scored;DT: n=7, 1,592 insulin+-cells scored; Welch’s test [p<0.0001], Mann-Whitney [p=0.0167]). Arrow: YFP+/somatostatin+ cells; arrowhead: YFP+/insulin+ cells;. e) In controls, 99.9% of the YFP+ cells are somatostatin+ (n=3, 1,673 YFP+-cells scored). In contrast, at 1.5 mpa only 55% of the YFP+ cells are somatostatin+, while 45% of the YFP+ cells are insulin+ (n=5, 2,295 YFP+-cells scored; Welch’s test [p<0.0001], Mann-Whitney [p=0.0357]). f) Comparative evolution of glycemia after β-cell (n=5), δ-cell (n=4) and β- & δ-cell co-ablation (n=5) in younglings. g) δ-cell conversion sequence. Scale bars: 20 μm. Error bars: s.d.

