Fig 8.
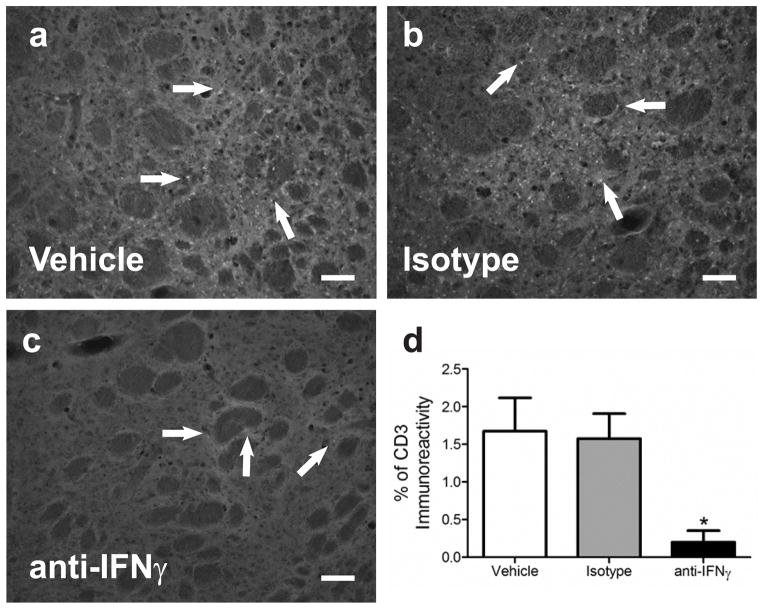
CD3 immunoreactivity decreased in IFNγ antibody treated brains. The amount of T cells in the brain following MCAO is decreased in the IFNγ antibody treated group (n=3) compared to controls (*p<0.04; n= 4 each;d). Images are from the striatum of the ipsilateral hemisphere. There is decreased CD3 (T cell) immunoreactivity in the brains of IFNγ antibody treated animals (c) compared to the amount of staining in the two control groups PBS vehicle (a) and isotype (b). Scale bars = 100 μm. Arrows indicate areas of staining.

