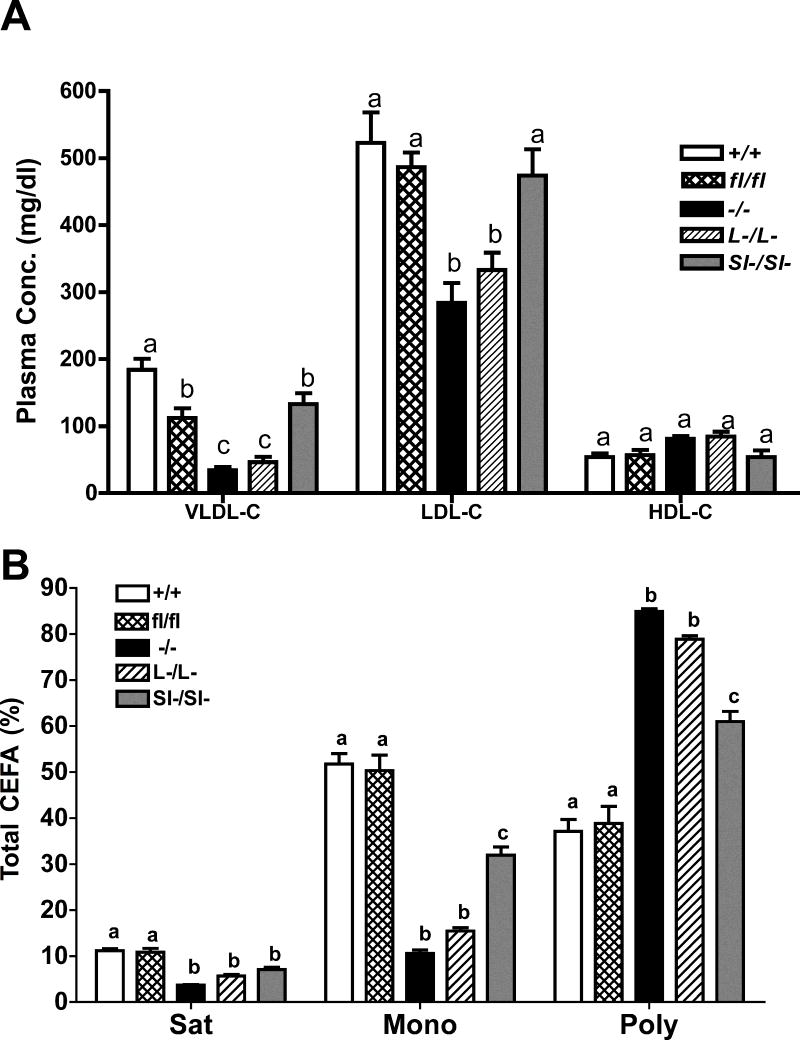
Figure 2. SOAT2 knockouts affect cholesterol distribution and fatty acid composition of cholesterol esters isolated from plasma LDL.
(A) Plasma cholesterol distribution quantified by FPLC. VLDL-C: very low-density lipoprotein cholesterol; LDL-C: low-density lipoprotein cholesterol; HDL-C: high-density lipoprotein cholesterol. N = 17 to 18 per group. (B) Percentage of saturated, monounsaturated, polyunsaturated fatty acids to total fatty acids found in LDL-CE. Plasma LDL fraction was identified by FPLC and corresponding elution was collected. Total lipids were extracted with chloroform/methanol. CE species were quantified by LC-MS. Vales are expressed as percentage of the mass of CE containing saturated, monounsaturated or polyunsaturated fatty acids to total mass of CE recovered in LDL. Data represent the mean ± SEM from 9 to 10 samples per group. Statistical analyses were performed in each subclass of lipoproteins or each fatty acid species. Bars not sharing common letters differ with P < 0.05.

