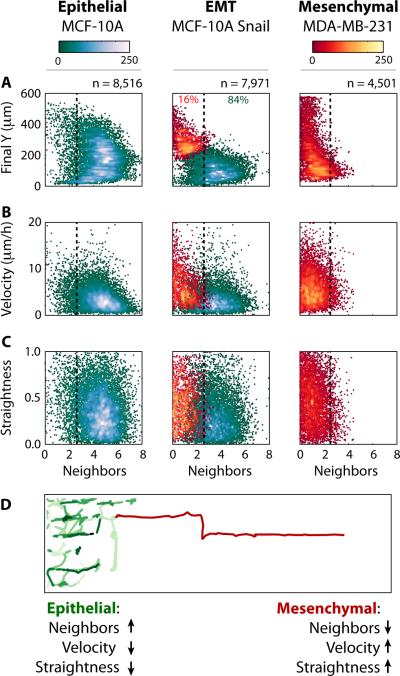
Fig. 2. Differences in migratory behaviour associated with collective or individual migration phenotypes were classified using a Gaussian mixture model.
The lifetime-averaged nearest neighbours of the migrating cells are compared to (A) the final Y position in the device, (B) averaged velocity, and (C) path straightness. Overall, at the completion of the experiment, individually migrating cells are observed to the front with collectively migrating cells at the rear. (D) Single cell tracking reveals that individually migrating cells scatter effectively due to increases in speed and straighter trajectories, relative to collectively migrating cells.

