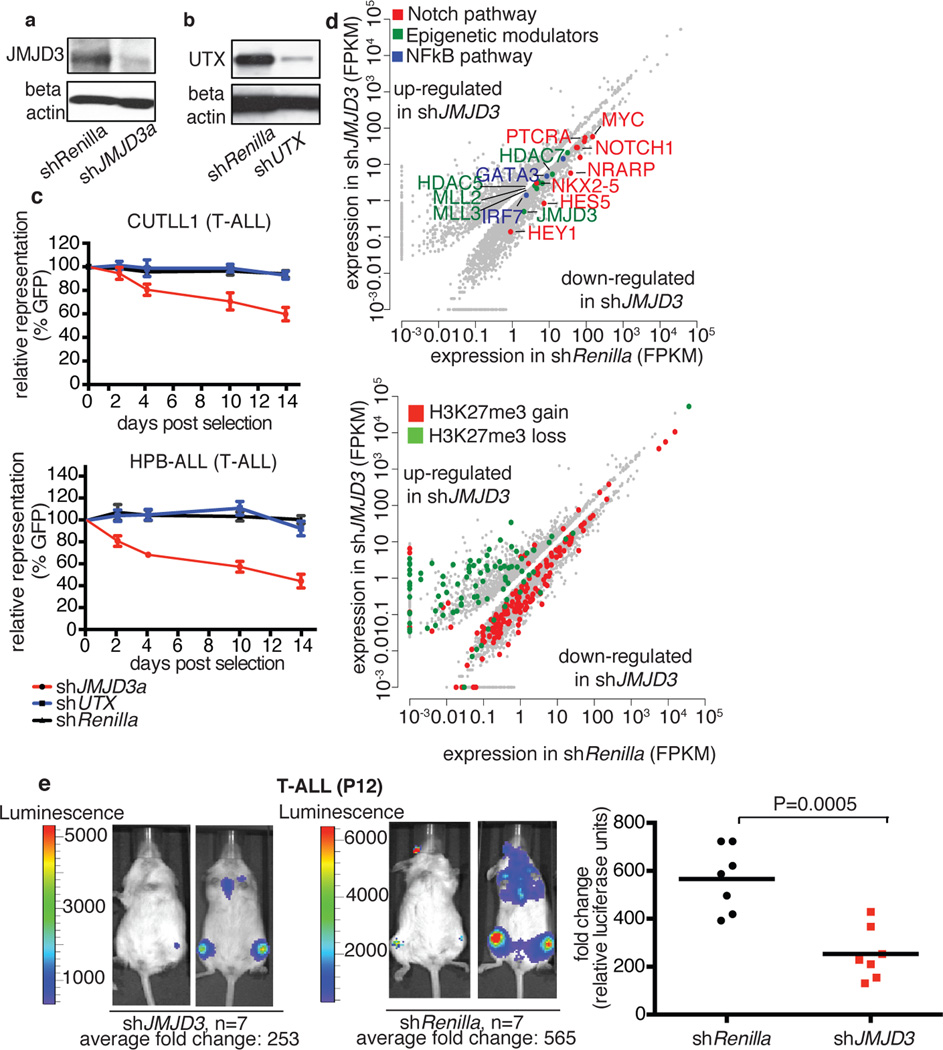
Figure 2. Dissecting the oncogenic role of JMJD3 in T-ALL.
Protein levels of JMJD3 (a) and UTX (b) in T-ALL cells (CUTLL1), expressing corresponding shRNAs against the two demethylases. Representative plots of three independent studies (biological replicates) are shown. c, Effects on T-ALL cell proliferation as measured by loss of GFP-expressing hairpin. In all lines the average of three representative studies is shown. d, Differential expression analysis upon knockdown of JMJD3 in T-ALL (top panel). Loci of downregulated genes exhibit an increase of H3K27me3 (red dots in the bottom panel), while upregulated genes exhibit decrease in H3K27me3. Representation of three independent studies is shown. e, In vivo growth of P12 T-ALL cells in i.v. xenograft studies upon genomic ablation of JMJD3 and Renilla (control). One million P12 cells were injected into seven animals. Sublethally irradiated Rag γc−/− immuno-compromised mice were used as recipients and transplantation leukemic cell growth is compared to the baseline (day zero). Day zero is the first day when substantially detectable luciferase intensity was measured. The last day of the experiment was the day that either luciferase intensity reached saturation or the mice were euthanized for humanitarian reasons.

