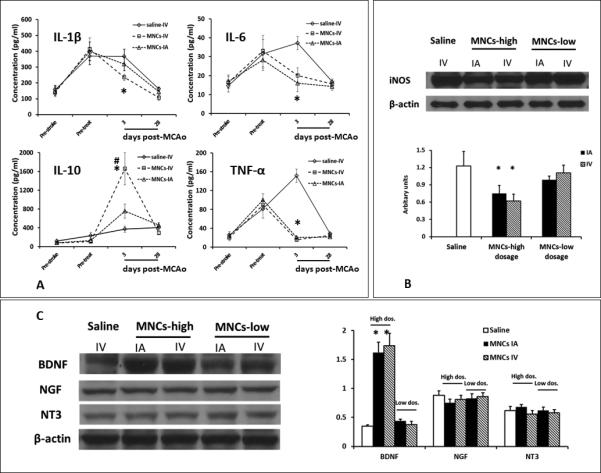
Fig 4. High dosage MNCs altered the profile of inflammatory cytokines and Neurotrophin expression after stroke.

4A: Line diagrams indicating the alterations of serum pro-inflammatory and anti-inflammatory cytokines in animals treated with 3×10⁷ cells/kg MNCs via IA or IV delivery. Data are Means±SD. Animals treated with low dose MNCs (1 × 10⁶ cells/kg) are not shown to preserve clarity of the graph as the cytokine profile was not significantly different from saline treated animals. Statistical tests were performed across all groups including high and low dose treated animals. *p< 0.05, compared to saline group. #: p<0.05, compared to IA delivery route. Saline n=18, MNCs IV n=10, MNCs IA n=11.
4B: The Western blots indicate that iNOS was reduced in the brain from animals treated with high dosage MNCs IA or IV at day 3 after stroke but not with low dosage MNCs IA or IV, compared to saline control. Data are Means±SD. N=3 animals. *: p<0.05, compared to saline group.
4C: Representative immunoblots of neurotrophins and a quantitative bar graph. High dosage MNCs by IA or IV routes increased BDNF expression compared with saline controls. However, there was no significant difference between IV and IA delivery. Low dosage MNCs did not change the levels of any of the neurotrophins. Data were analyzed across all groups and represented as Means±SD. N=3 animals. *: p<0.05, compared to saline group.
