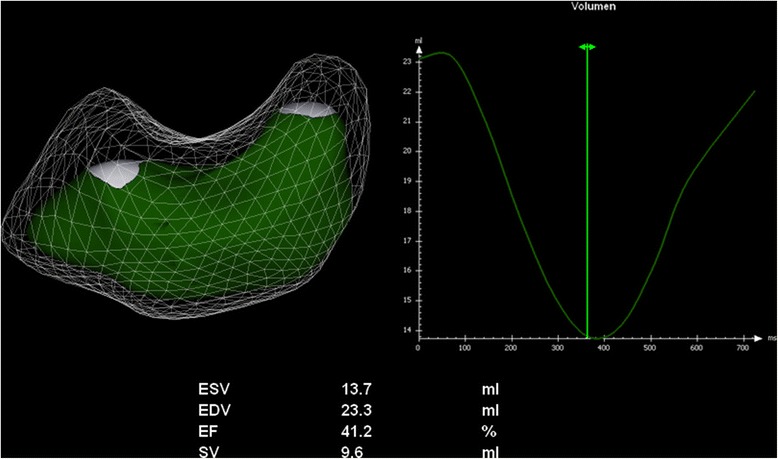
Figure 2.

Results of three-dimensional echocardiography right ventricular function analysis of an anaesthetised healthy beagle. The model of the RV surface shows the end-diastolic volume (EDV) as transparent volume, whereas the end-systolic volume (ESV) is shown in green. The volume-time curve (VTC) demonstrates the changes of right ventricular volume (y-axis) over time (x-axis). Automatically minimal volume (ESV) and maximal volume (EDV) as well as ejection fraction and stroke volume are calculated from this VTC.
